Web Performance Monitoring
Understanding Core Web Vitals & Why They Matter
Have you ever noticed that some websites appear to load quickly, but then suddenly become unresponsive when you try to click on a button or image?
In the past, website owners relied on technical measurements such as the page load time to understand how fast a website loads on a visitor's device. Site speed is a useful metric to track, but page load time does not tell the full story when it comes to user experience. That's where Core Web Vitals come in.
In this guide, you'll learn what Core Web Vitals are, how they affect search ranking and user experience, and we'll cover some practical tips on how to easily measure these metrics.
What are Core Web Vitals
Web Vitals are a set of standardised metrics proposed by Google, that help understand how visitors are really experiencing a website, rather than relying on performance scores and artificial benchmarks.
In this guide we'll explore a subset of them called Core Web Vitals. These are three metrics that tend to have the largest impact on user experience, and the ones which we'll focus on for this purposes of this article:
- Largest Contentful Paint (LCP), how fast the main content on a website loads.
- First Input Delay (FID), how quickly can a visitor start interacting with a site.
- Cumulative Layout Shift (CLS), how visually stable is the website layout as content loads.
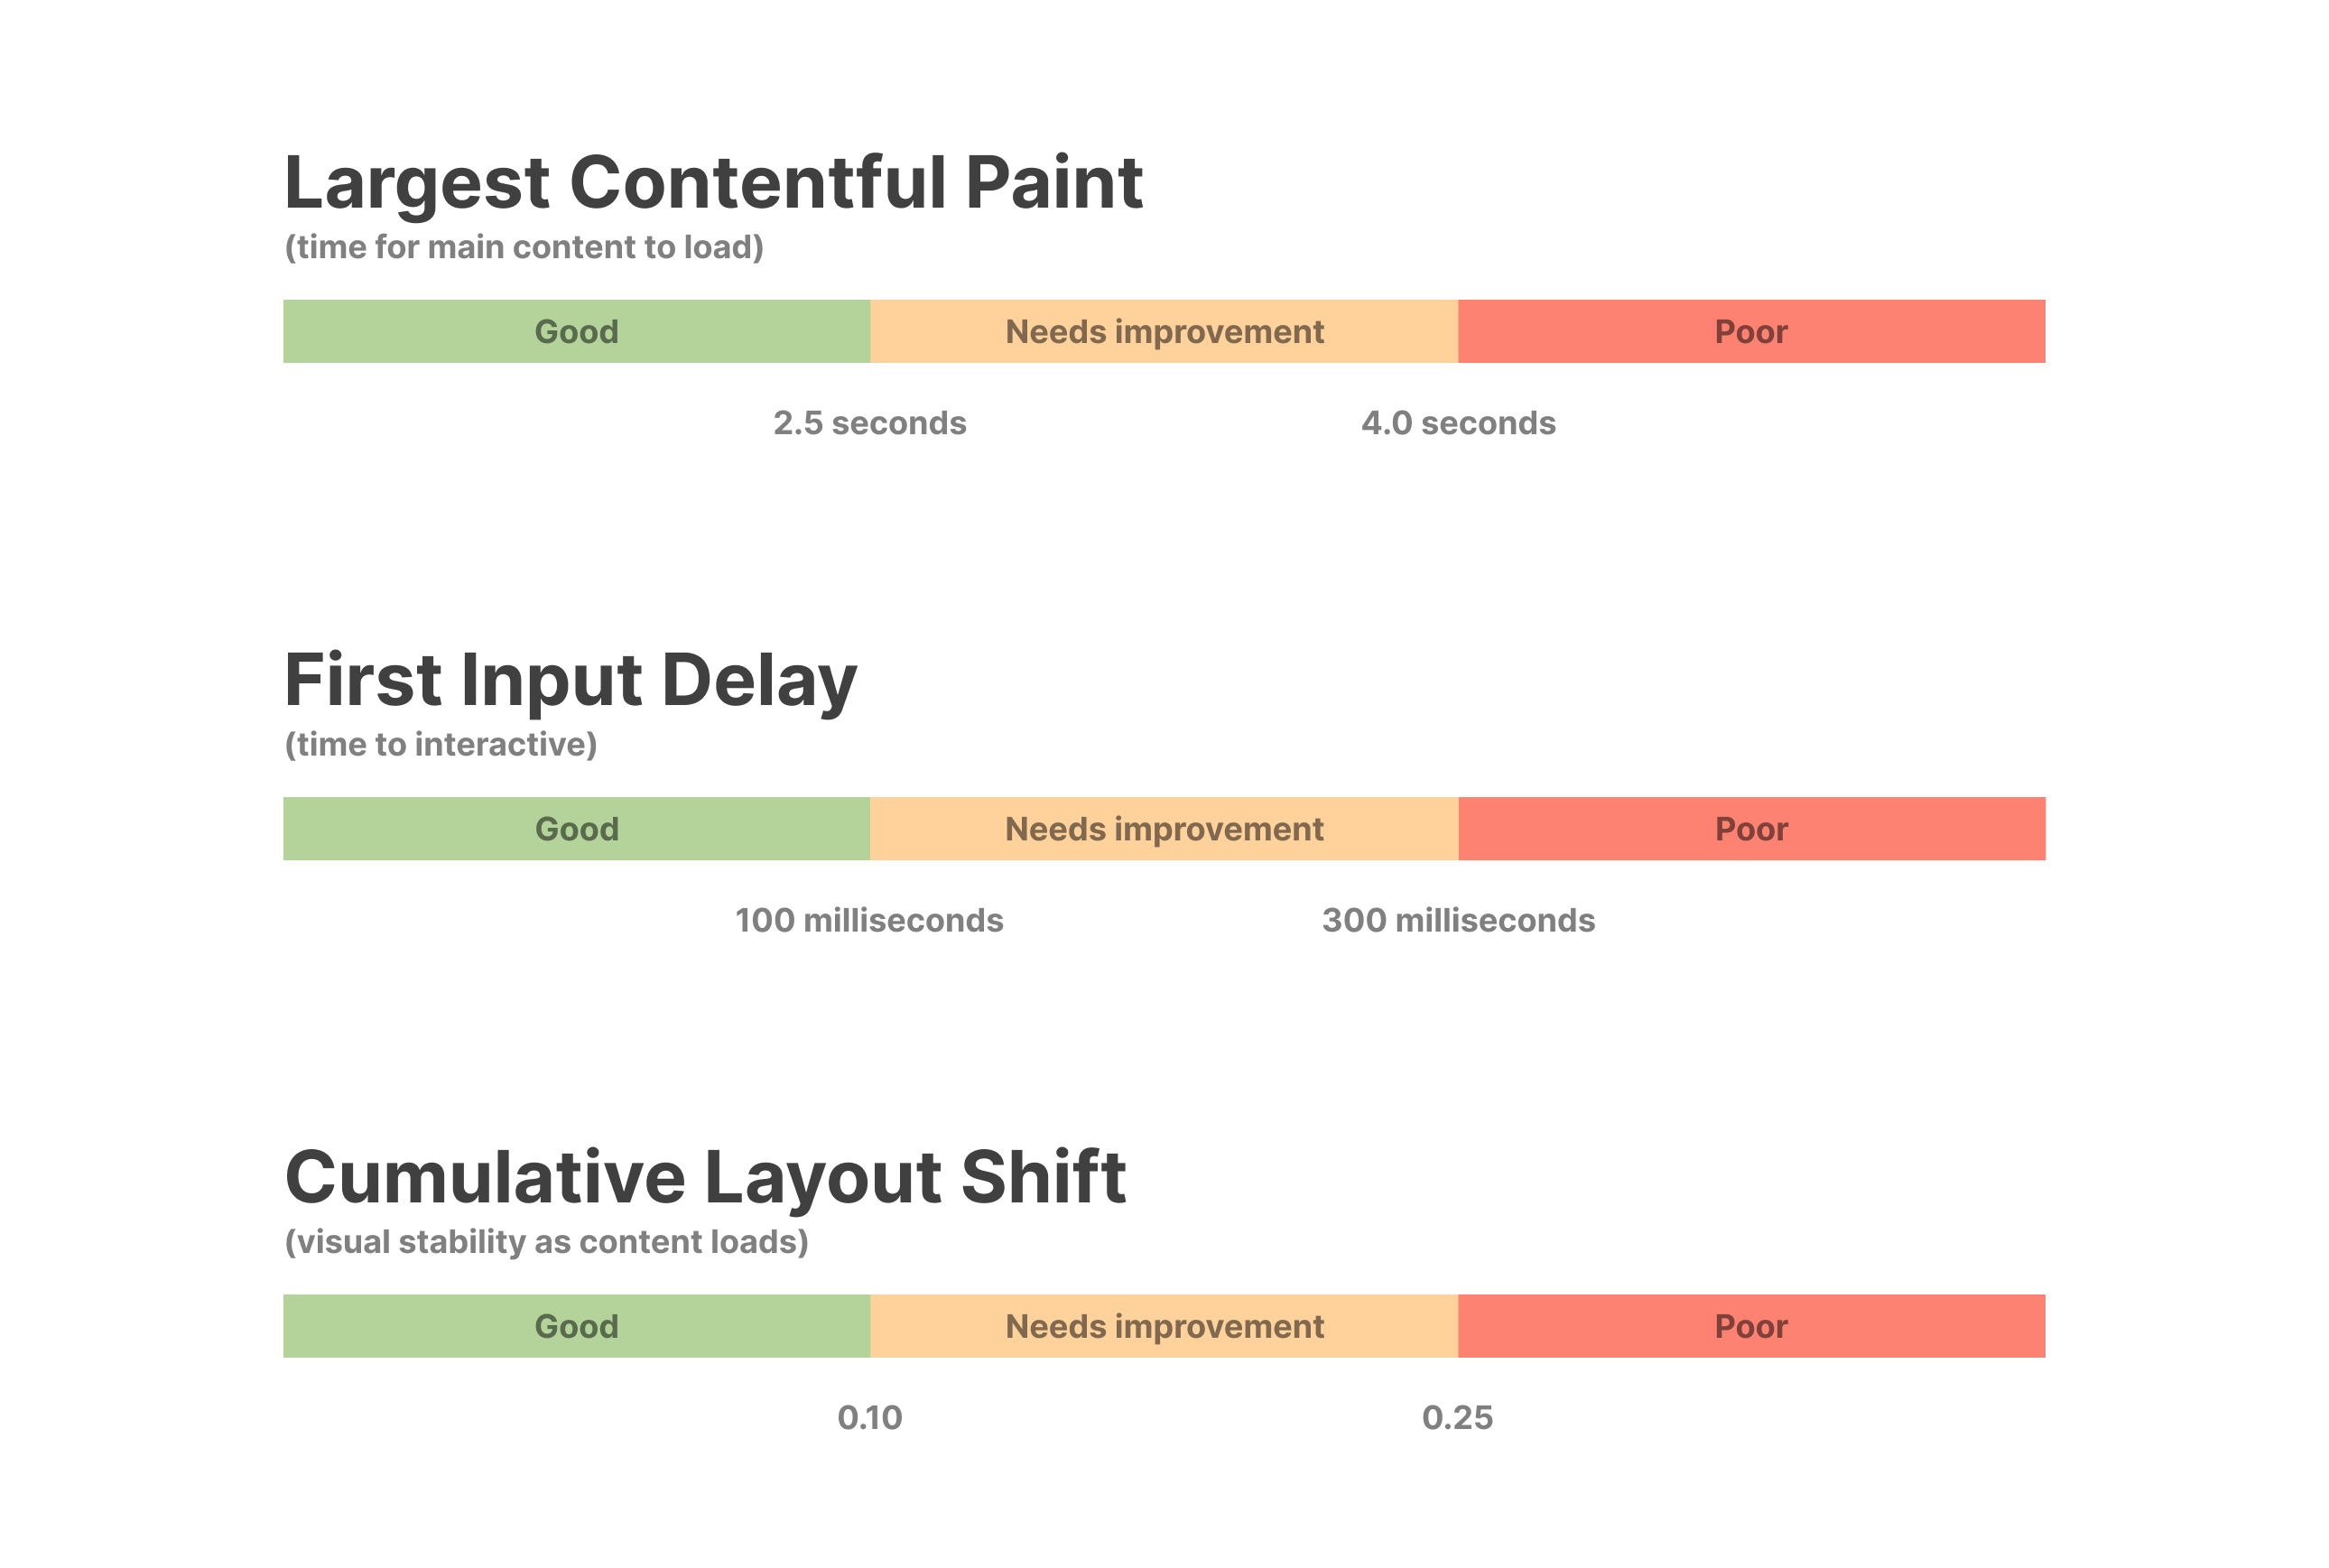 Recommended Core Web Vitals targets.
Largest Contentful Paint
Largest Contentful Paint (LCP) is a metric that measures how long it took for the main piece of content to load on the screen, as opposed to the time it took for the entire page to load.
Which component is the main piece of content highly depends on your website. Most tools that measure this metric will automatically identify the largest block of content presented on the website as it loads.
Things that might affect LCP include large images, video players, website backgrounds, large blocks of text, and other render blocking resources. Essentially, anything that might cover a large portion of the initial viewport.
How is it different from page load time?
It's different from the page load time, as it measures what the visitor perceives instead of the actual number on paper. For example, while a page might load in 5 seconds, the main piece of content, such as a big image, or block of text might have already loaded 2 seconds in. That means that the remaining 3 seconds are just spent on loading secondary content which does not prevent the visitor from already looking at the site.
Recommended thresholds
It's generally a good idea to keep LCP within 2.5 seconds to ensure your website feels fast, and visitors don't leave while waiting for something to appear on screen. An LCP of 4 seconds or more is considered to lead to a poor experience.
First Input Delay
First Input Delay (FID) measures input delay. In other words, it measures how quickly a user can start interacting with a website, even if it’s still loading.
For example, maybe a page is still loading, but the visitor wants to click on a button or expand an image that is already visible on screen. There's no need to wait around in order to be able to perform an action. If the site immediately reacts to these interactions, it feels snappy and responsive.
Unlike the other two Core Web Vitals, FID is difficult to measure using "offline" tools. It's best to measure it using real-user monitoring tools. The reason being that it requires actual user input in order to measure it.
Field data tools (or real-user monitoring) perform continuous measurements on a website's live traffic, painting a much more accurate picture of a website's performance under real world scenarios.
That's why FID is best measured using field data tools, as it depends highly on what is being clicked, how much of the website has loaded so far, the internet connection speed, and various different scenarios which are not easy to replicate in artificial tests.
Recommended thresholds
Google recommends a FID of 100 milliseconds or less, while an input delay larger than 300 milliseconds can lead to a poor user experience.
It may be tempting to try and reduce input delay to a minimum, but it's important to consider that there's a practical limit on how much better it can be. While most humans can notice the difference between 800 milliseconds and 100 milliseconds, a 10 millisecond difference might be just barely noticeable.
Cumulative Layout Shift
Cumulative Layout Shift (CLS) measures the visual stability of a website. In other words, it measures by how much the main elements shift around as the page loads.
To understand it, you have to put yourself in the shoes of the visitor. It can be highly frustrating when a button or image moves around while you're trying to focus on it. Even worse when you end up clicking on something you didn't want because the content moved around as the page continued to load. That's why striving for visual stability as the page loads is important.
CLS can be affected by lazy loading images, delayed popups, banners, and wrongly-sized placeholder blocks or images. Essentially anything that can cause significant layout changes as a page loads.
Recommended thresholds
Keeping your CLS score to a minimum can greatly improve your website's usability. Google recommends a CLS of 0.1 or less, which can help reduce frustrated visitors which may just be leaving your site due to having a poor experience.
How to measure Core Web Vitals
Peter Drucker is often quoted as saying that "if you can’t measure it, you can’t improve it". The point being that you can't know with certainty whether something worked or not just by guessing. Without data, all we have are opinions, which may differ from the truth.
On that principle, the first step towards delivering a great experience on your website should be to start measuring the metrics that matter. That way you'll know where you stand, and whether any changes you perform have a positive effect on the end-user experience.
You can start by performing synthetic checks on your website using lab tools such as Lighthouse in order to understand the current state of your website.
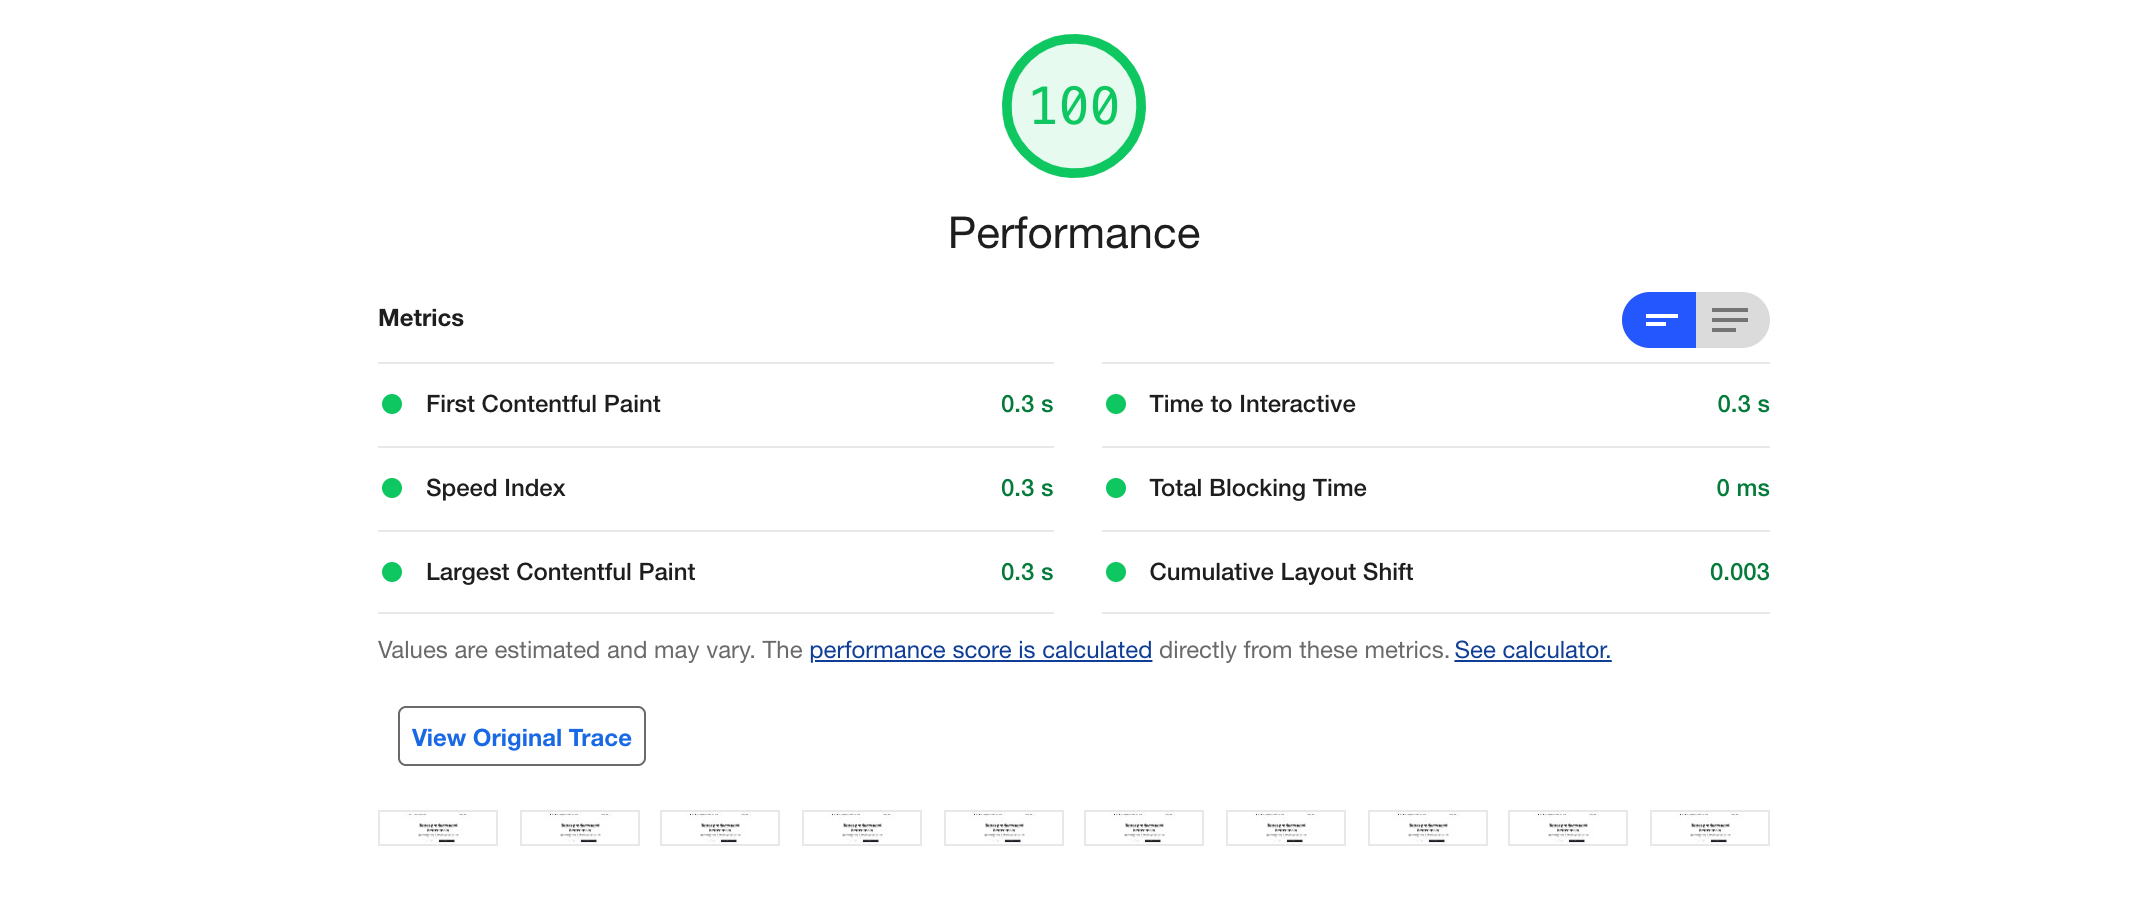 Example lighthouse report.
Once you have identified existing issues, and possible improvements. You could add a monitoring solution, either lab-based (offline checks) or field-based (using real traffic), in order to continuously monitor the metrics that matter for you.
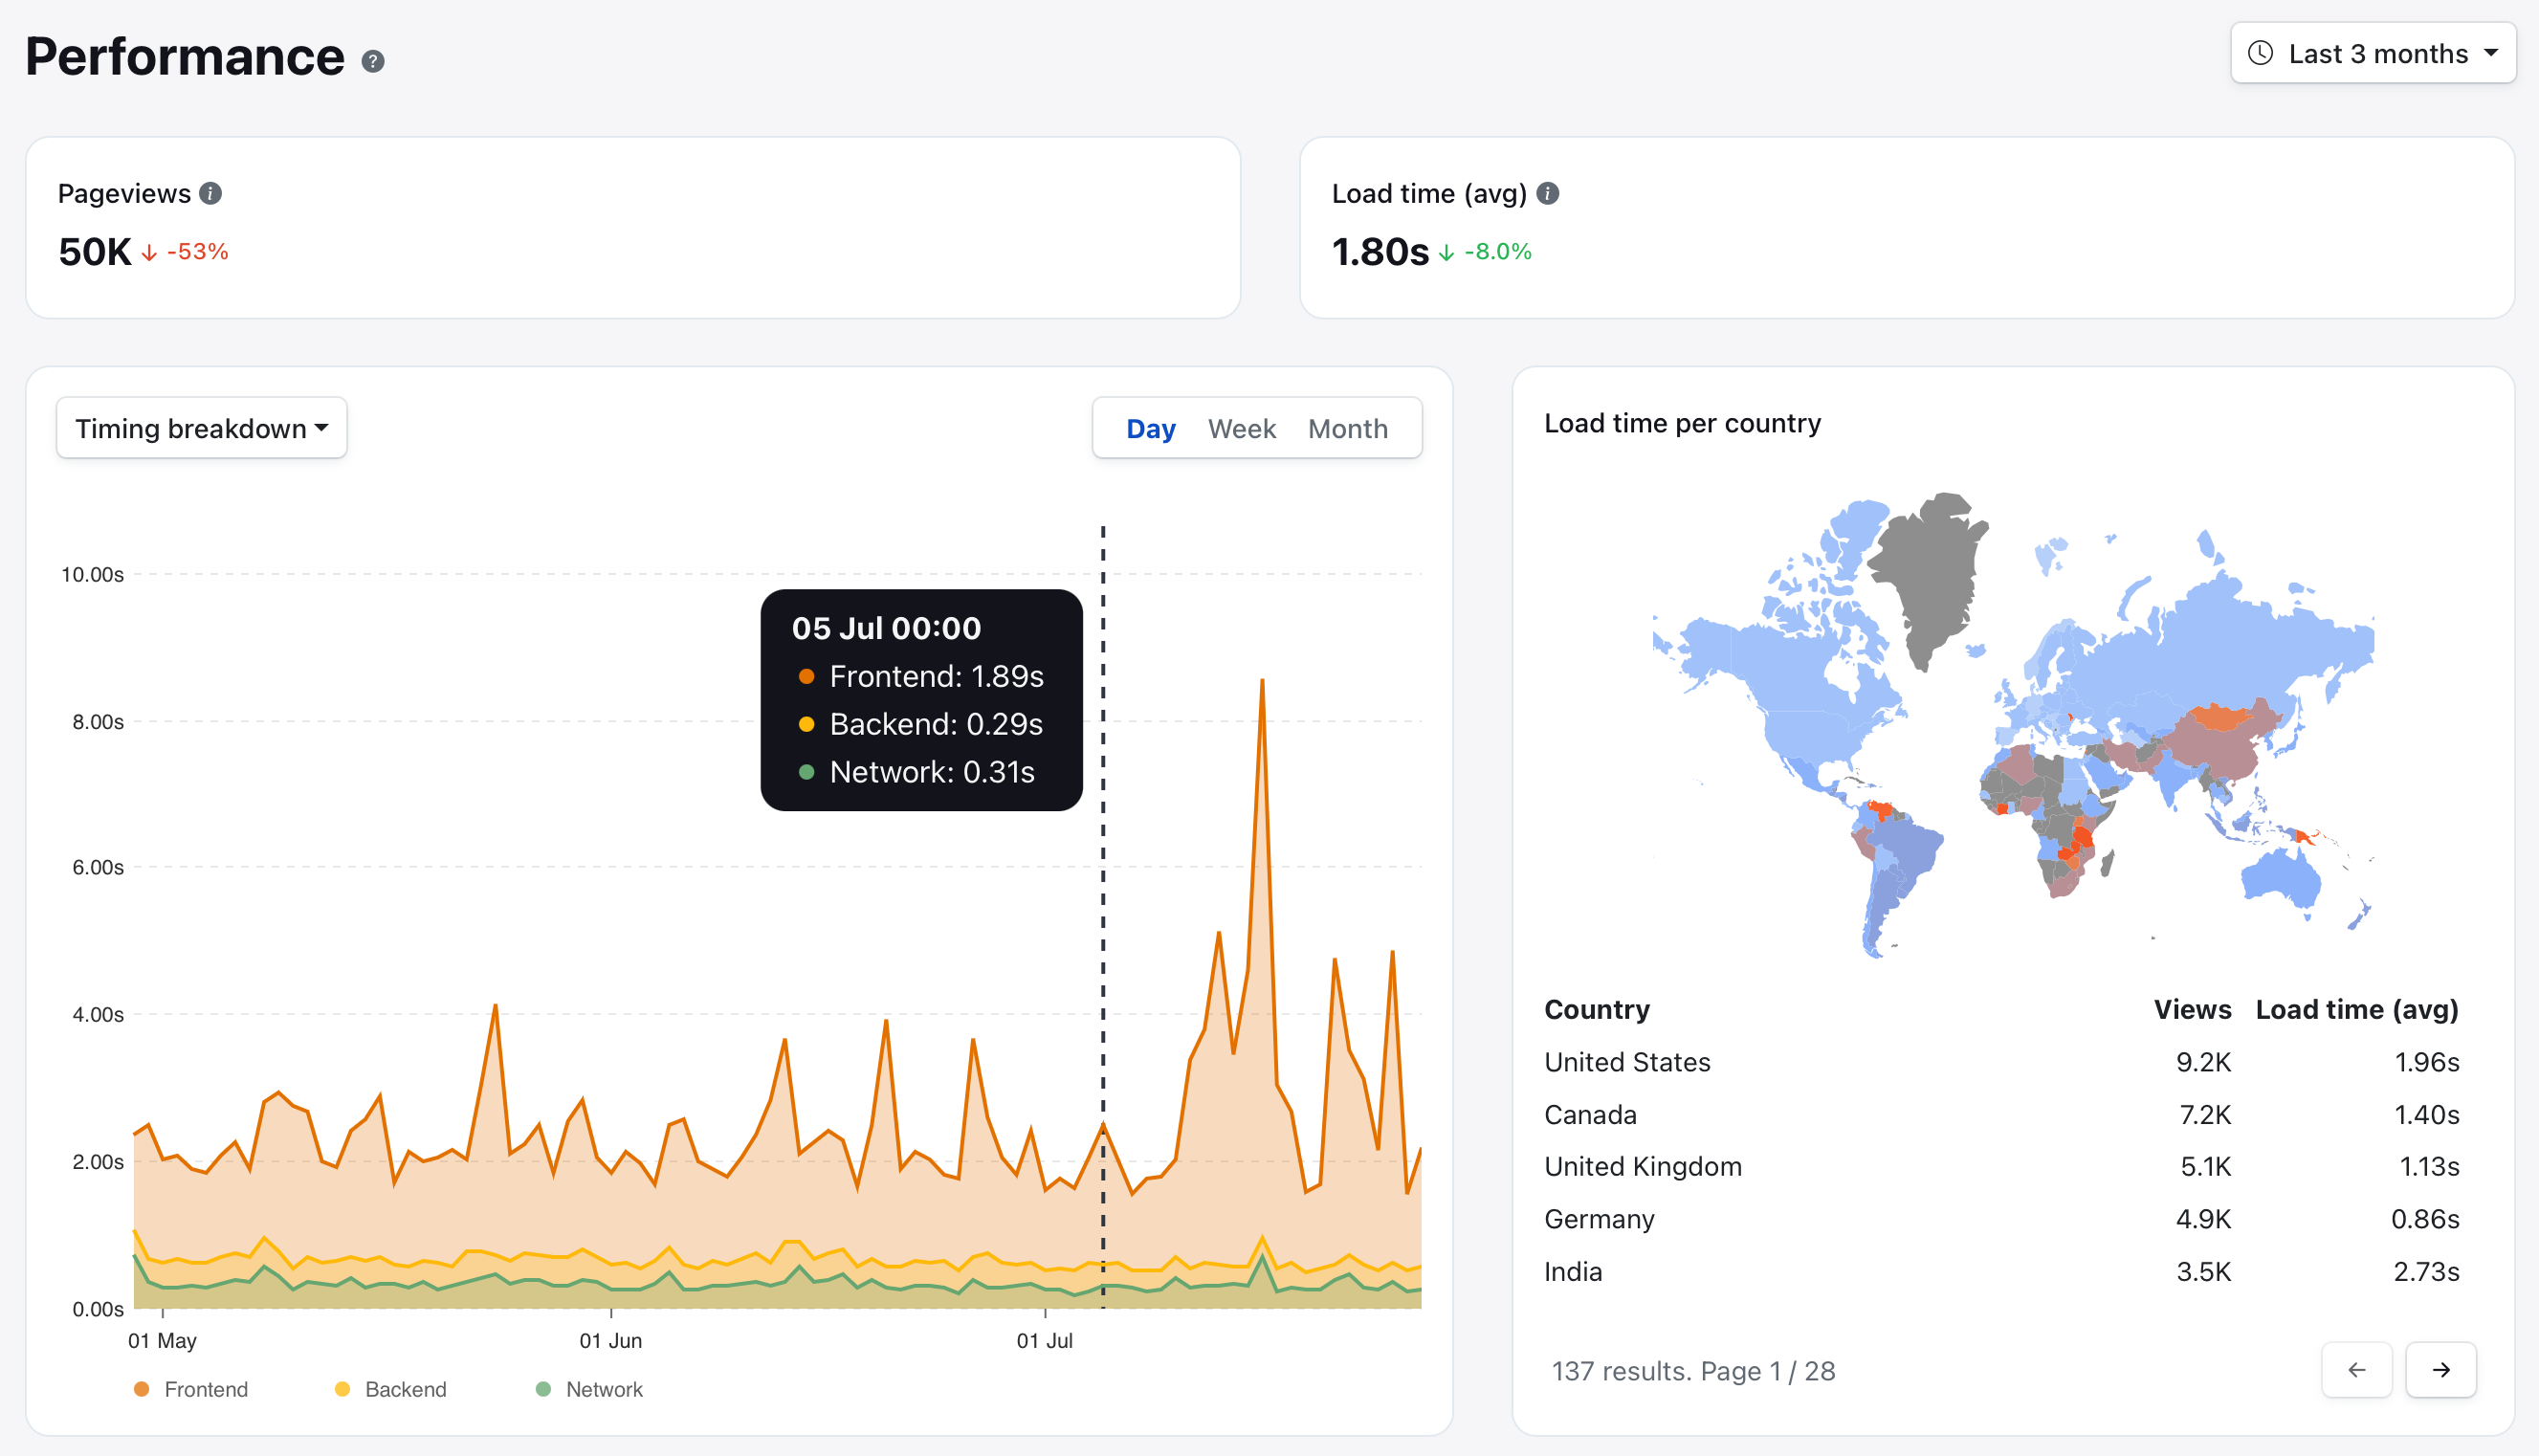 Example from Cronitor's real-user monitoring dashboard.
Real-user monitoring tools measure additional metrics too.
In order to achieve the best results, most websites use a combination of tools as part of their monitoring stack. It's often recommended to measure at least three things: overall visitor traffic, performance, and uptime. After all, you don't want to be the last to know when your website is trending, unresponsive, or even worse, having downtime.
Field data vs lab data
You can use a variety of tools to measure your Core Web Vitals. While some metrics are easy to measure using lab tools which perform checks in a simulated environment, some of them are best measured using real traffic samples of how visitors interact with each page.
The distinction between the two types of tools is in how they take the measurements. On one hand there is lab data (or synthetic monitoring), which performs checks in a simulated environment, and on the other hand there's field data (or real-user monitoring), which takes measures from the real visitor traffic on a website.
Tools that support core web vitals
To help get started, here's some of our favourite tools to measure Web Vitals:
- Cronitor (field data)
- Lighthouse (lab data)
- PageSpeed Insights (lab data)
- Search Console (field data)
- Web-vitals Javascript library (field data)
- Datadog (field data)
No tool will be best suited for every possible scenario, so it's advisable to mix and match the ones that best suit your needs.
Do Core Web Vitals impact search result rankings?
Having a fast, responsive website is more important than ever. Besides leading to a better experience for your website visitors, search engines such as Google consider Web Vitals a ranking signal.
This makes sense, search engines generally want to rank websites higher when they offer more relevant, useful content for a given user search. If the content is good, but the website which presents it is unusable or bounces off a lot of visitors, Google may interpret this as a signal that visitors are not satisfied with the proposed search result.
In other words, delivering a great user experience is just as important as having good, quality content. It's about the entire user experience, and optimising for it may help website owners get more relevant search traffic, and a higher ranking position.
Conclusion
In this guide you've learned what Core Web Vitals are and why are they important. We also covered how they affect search result rankings, the differences between field data and lab data, plus some practical tips on how to measure these important metrics on your website.