Web Performance Monitoring
What Is Real User Monitoring (RUM) & Why It Matters
Real user monitoring (RUM) is the process of collecting, organizing, and analyzing data about how your users experience and interact with your website or application.
Real user monitoring tools provide capabilities beyond website analytics tools, providing a holistic understanding of the interplay between user experience and website performance in real-time.
You can use real user monitoring for a variety of purposes, such as being alerted to site errors or slow page load times, measuring Core Web Vitals, monitoring traffic spikes, and tracking key user journeys to understand how web performance metrics influences core business metrics.
Why Real User Monitoring Matters
Real user monitoring gives you the data you need to create the best possible user experience for your customers. With insights from RUM data, you can design experiences for specific types of users, troubleshoot and solve performance problems, monitor critical business metrics, understand the quality of different traffic sources, improve the efficacy of marketing channels and more.
Most importantly, with the additional insight into user behavior and website performance, you can more efficiently identify and implement changes that impact your bottom line. For example, by using real user monitoring, Amazon discovered that every 100ms of latency cost them 1 percent in sales. Google had similar results when looking at the load time of the search engine, where a .5s difference in load time resulted in a 20 percent drop in search traffic.
How Real User Monitoring Works
Real user monitoring works by adding code to your website or mobile application that allows you to collate data on user activity and performance within each platform.
For a web-based application, you insert a script that can collect data about how users interact with your site. Using RUM for mobile applications, on the other hand, involves adding a monitoring library to your mobile application package.
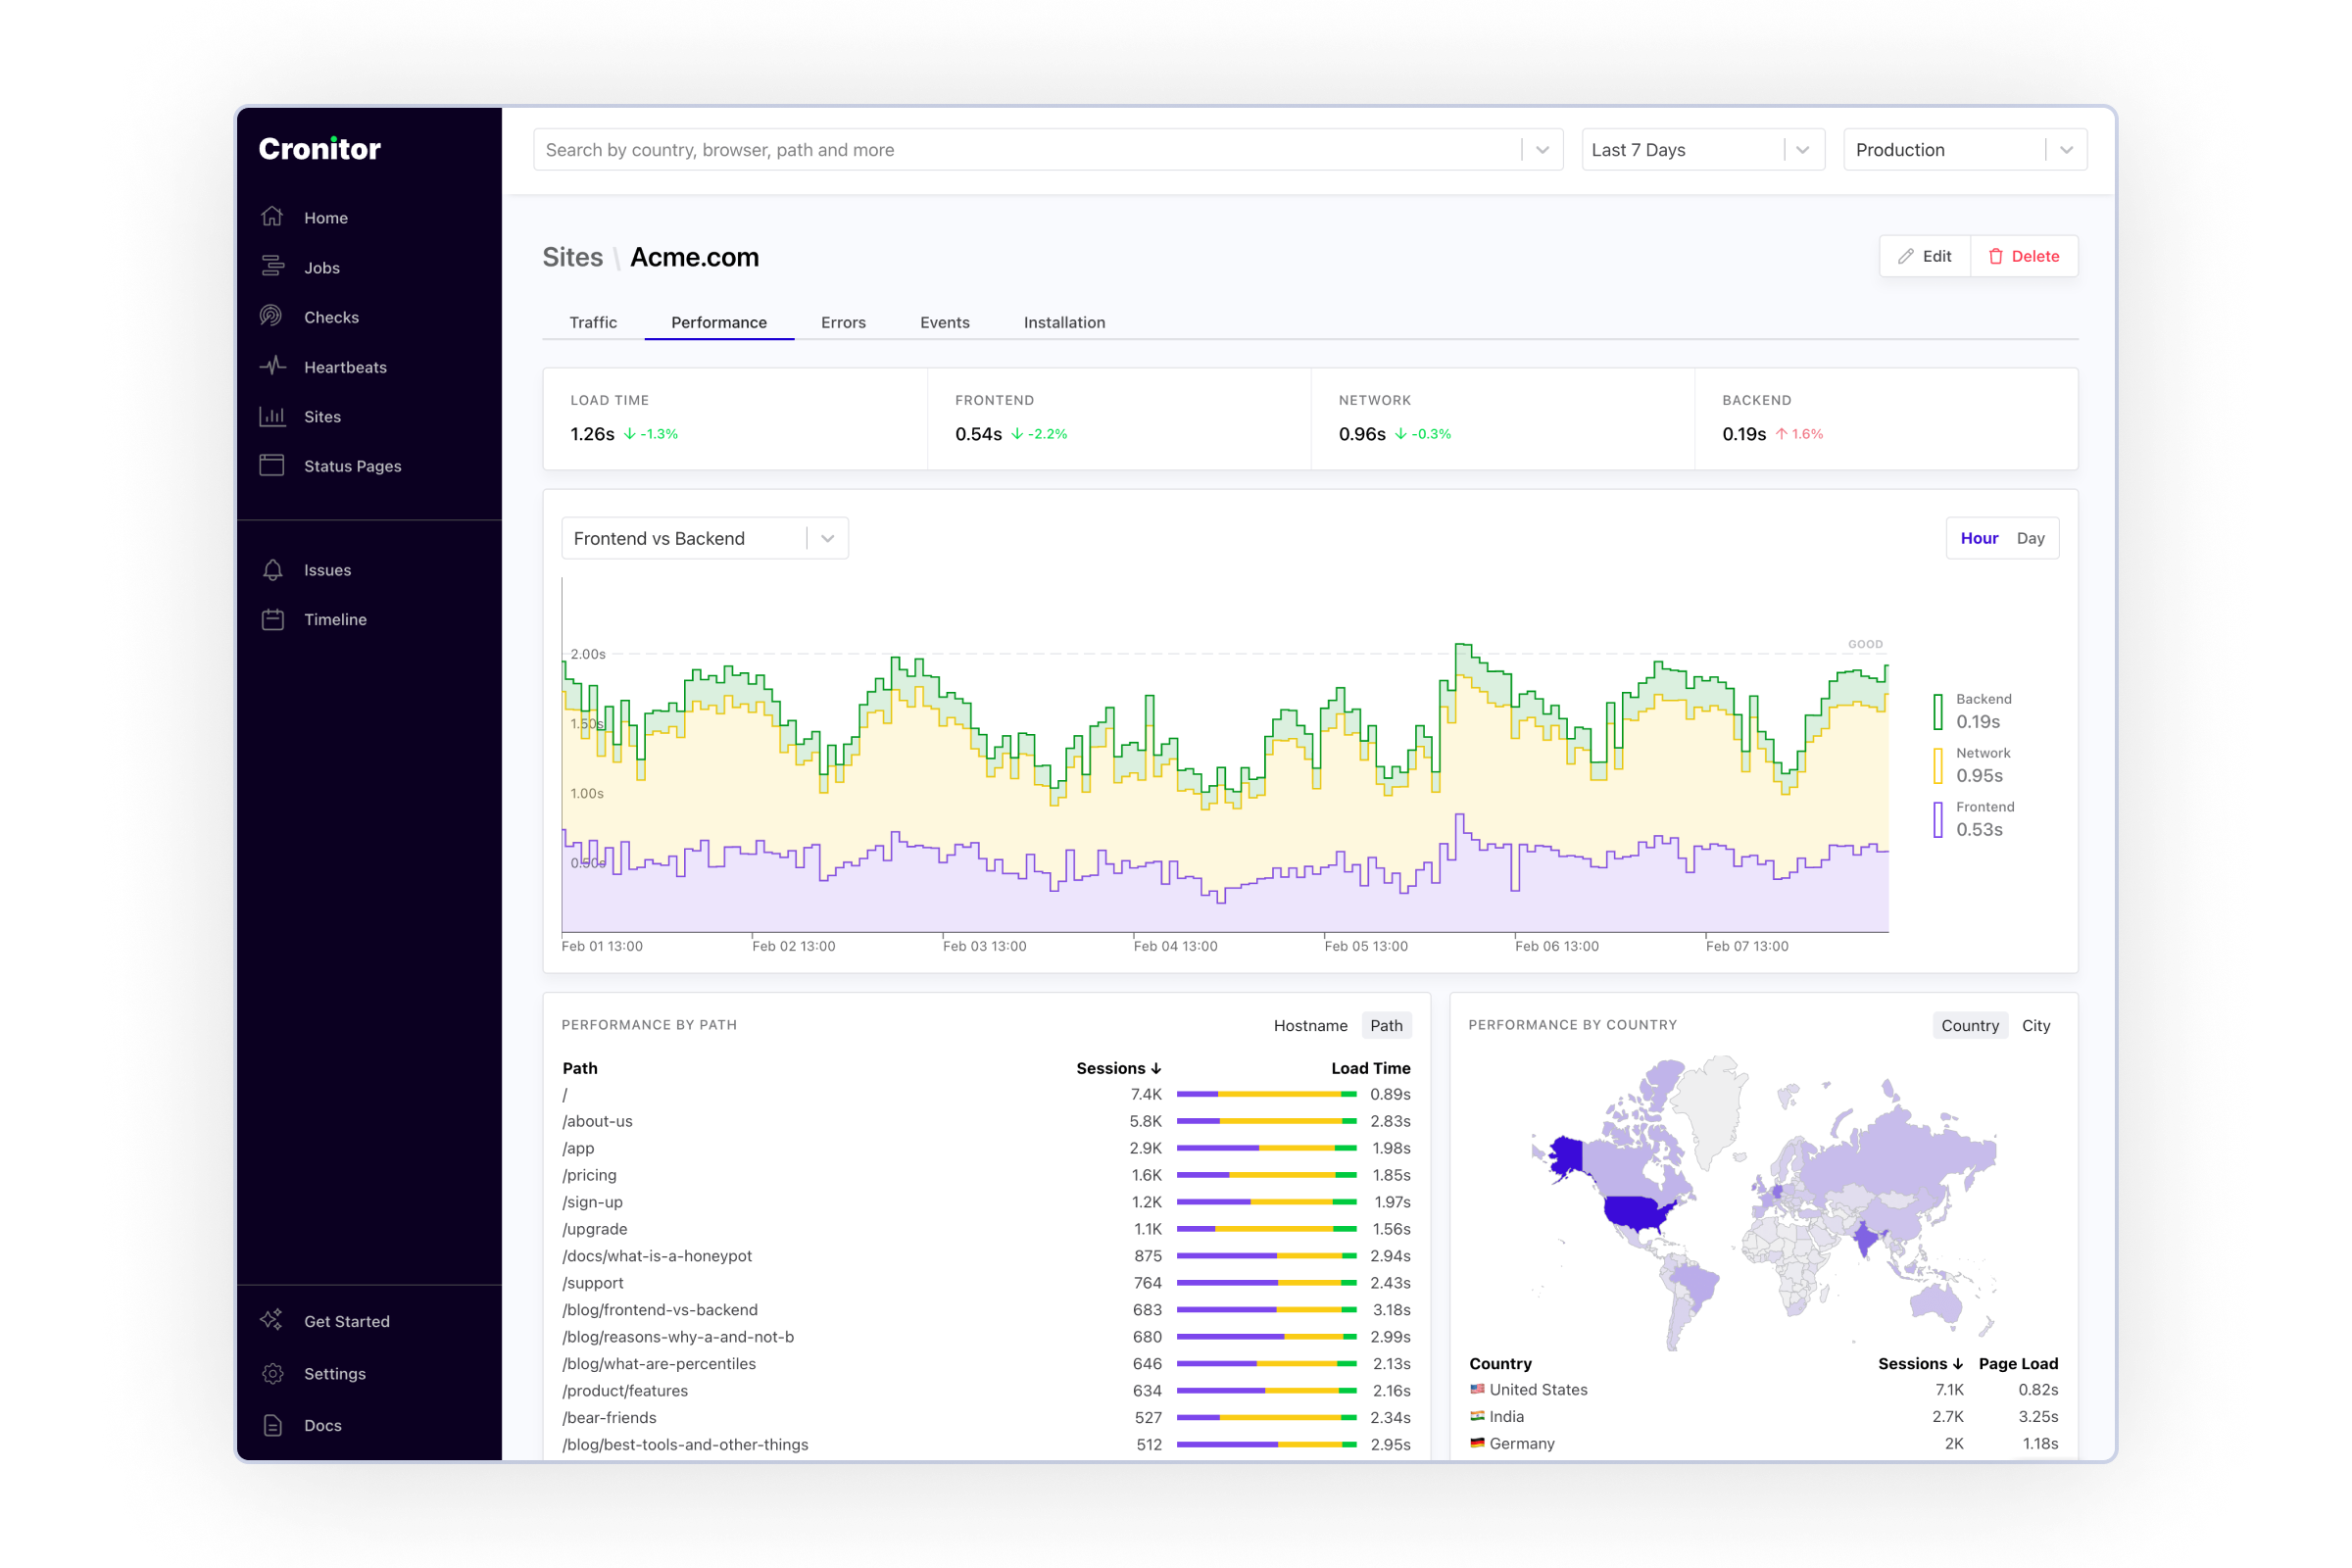
With RUM tools like Cronitor, your raw data is collated and then aggregated in a central, customizable dashboard where you can analyze and evaluate the data. Dashboards are often segmented across traffic, showing performance and other telemetry data. If everything is set up well, you can switch and scroll through the various visualizations and metrics to have a holistic view of your user data and website performance, allowing you to efficiently prioritize your efforts.

Real User Monitoring vs. Synthetic Monitoring
Real user monitoring and synthetic monitoring are the two primary ways to measure user interactions with your website. While real user monitoring provides data on the behavior of actual users, synthetic monitoring is the process of using scripts to simulate the expected experience of a user who performs specific actions. Both synthetic monitoring and RUM monitoring are important, but they're useful in different ways.
Synthetic monitoring is great for proactive testing, including pre-production testing, availability monitoring, competitive benchmarking, and page load time monitoring.
Real user monitoring, on the other hand, will allow you to get a rich set of data about what your real users are doing. You can use this RUM data to see how different user segments behave, understand the customer journey, and monitor conversion rates, transactions, and other important business metrics.
In short, synthetic monitoring is a tool for understanding the baseline expected performance for different behaviors on your website or application, whereas RUM monitoring will allow you to understand and optimize the end-user experience based on data from real users.
Real User Monitoring Examples
There are many ways to leverage data from real user monitoring:
- Website Analytics: Like Google Analytics, real monitoring tools can help you collect and use valuable data about your website, such as the most popular pages, user engagement on different devices, information on user sessions, where users are dropping off or converting, and more.
- Marketing Channel Optimization. You can use RUM data to understand the behavior and performance of users from specific campaigns and marketing channels. This can help you improve user engagement and the overall ROI of your advertising spend.
- Performance Enhancement. Real user monitoring tools can help you monitor vital website metrics like page load time, how performance changes with traffic spikes, pages with poor performance, and other factors that impact the user experience and your bottom line.
- User segmentation: With RUM tools you can segment your traffic and compare metrics for one such group of users vs another. This is useful to surface new insights and optimize your site for your main audience. For example, you can compare whether visitors from one country are more likely to purchase a product vs another or whether visitors on mobile devices spend more time on your site than those on desktop.
- Evaluating Website Changes. Monitoring your website and user-interaction metrics is especially important as changes you make over time may introduce flaws to the user experience despite your best intentions. Users can be easily irritated by slow websites, confusing user interfaces, and strange website navigation patterns. RUM allows you to monitor user experience and performance issues constantly.
- Monitoring & Alerting. With tools like Cronitor, you can use RUM to get notified when something important happens on your website, such as a page receiving more traffic than usual, a suddenly slow-performing part of the site, or learning when conversion rates drop below a critical threshold for some period of time. Your development team can set their own alerts and receive a notification as soon as something important happens. That way, the time to detect and resolve an incident is reduced, and the number of impacted visitors is kept to a minimum.
Limitations of Real User Monitoring
While real user monitoring can provide data to improve your user experience and bottom line, there are a few limitations of RUM.
- Data collection and visualization. Because there is so much variation in the behavior of users and data that you can collect, RUM may not be useful if you don't have a solution that makes it easy to query and visualize the data you're capturing.
- Low usage. If your website or application has low usage, you may not be able to collect enough data on users to make improvements with a real impact.
- Product changes. When you make an important change to your website, it will take time to collect enough RUM data to understand how those changes impact users and various business metrics. This is one area where layering in a synthetic monitoring process can help.
You can mitigate the impact of these limitations by choosing the right RUM tool and by adding additional testing to your processes like synthetic monitoring.
Best Practices of RUM
Outside of choosing the right real user monitoring tool (discussed below), there are a few important steps for making sure that your RUM data has the impact you're looking for.
Identifying and tracking the right metrics. Because you can collect nearly infinite data with a good RUM tool, it's important that you understand and track the metrics that actually matter for your business. For example, while an e-commerce store may track things like abandoned cart metrics, a SaaS tool may be more interested in the conversion rate of a highly-trafficked product page.
Connecting technical goals with desired business outcomes. Real user monitoring is powerful because it allows you to measure the relationship between technical markers of your site's performance (e.g., page load time) and concrete business outcomes (e.g., conversion rates). That means that you can use a RUM tool to prioritize the technical effort on your team that has the highest impact on the business outcomes that matter most.
Understanding how different applications perform. If you have a business with a mobile and a web-based app, there will likely be large variations in how real users behave in these two environments. RUM can help you understand these differences in behavior and tailor your web and mobile experience based on that data.
Integrate RUM data across teams and planning processes. To make the most out of your data, you need to action it to drive measurable outcomes for your business. That process starts with educating teams and leadership across the company on how to use the data and making sure to integrate it into relevant planning processes.
Ensuring data integrity of your RUM. While RUM can provide you with data to improve your business, it's important to regularly test the integrity of your data. That means choosing a trusted RUM tool, getting the implementation right, and regularly assessing data quality in various environments over time.
How to Evaluate Real User Monitoring Tools
The most important feature of any real user monitoring solution is that you are able to get the data that you need for your business in a form that is easy to view and action. There are many companies that offer RUM solutions, but they often fall short in either their ability to easily collect mission-critical data or in how their platform allows you to see and use that data.
If you're looking for a RUM tool that also covers your synthetic & uptime monitoring needs, Cronitor is a monitoring platform with SDKs in a wide range of programming languages and an intuitive user interface with in-depth documentation.

Cronitor's RUM solution offers an easy-to-use suite of website uptime monitoring, alerting, traffic analysis, and customizable performance metrics that are viewable from an intuitive dashboard with real-time data. This dashboard can be modified and shared with all relevant engineering, marketing, product, and executive teams.