Incident Management
The Complete Guide to Status Pages
Picture this — it's 2 a.m. and your phone is ringing with an on-call alert.
Production is down, and there's a flood of support tickets. Your customers want to know what's going on and when they can access the site again.
Your team is focused on fixing the issue — the first rule of incident response is to stop the bleeding — but it's making it difficult to keep everyone in the loop during the heat of the outage.
Wouldn't it be nice to have a single page where you could publish incident updates that your customers could see in real-time? Enter status pages.
In this guide we'll explore what status pages are, and why you need one. We'll also create a status page from scratch, and cover some tips & tricks for making the most out of them.
What is a status page
A status page provides visibility into the current health of your software. It's a single page where anyone can view the latest status, any ongoing or past incidents.
Incidents happen. Whether you're a startup or a global enterprise what matters the most is how you handle them. Status pages help you turn every outage into an opportunity to build trust in your service.
With a status page, your customers can answer questions such as:
- Is your site up and running?
- How reliable is your service?
- What kind of performance can I expect from your API?
- Is there an ongoing outage?
- Where can I contact you in case of an emergency?
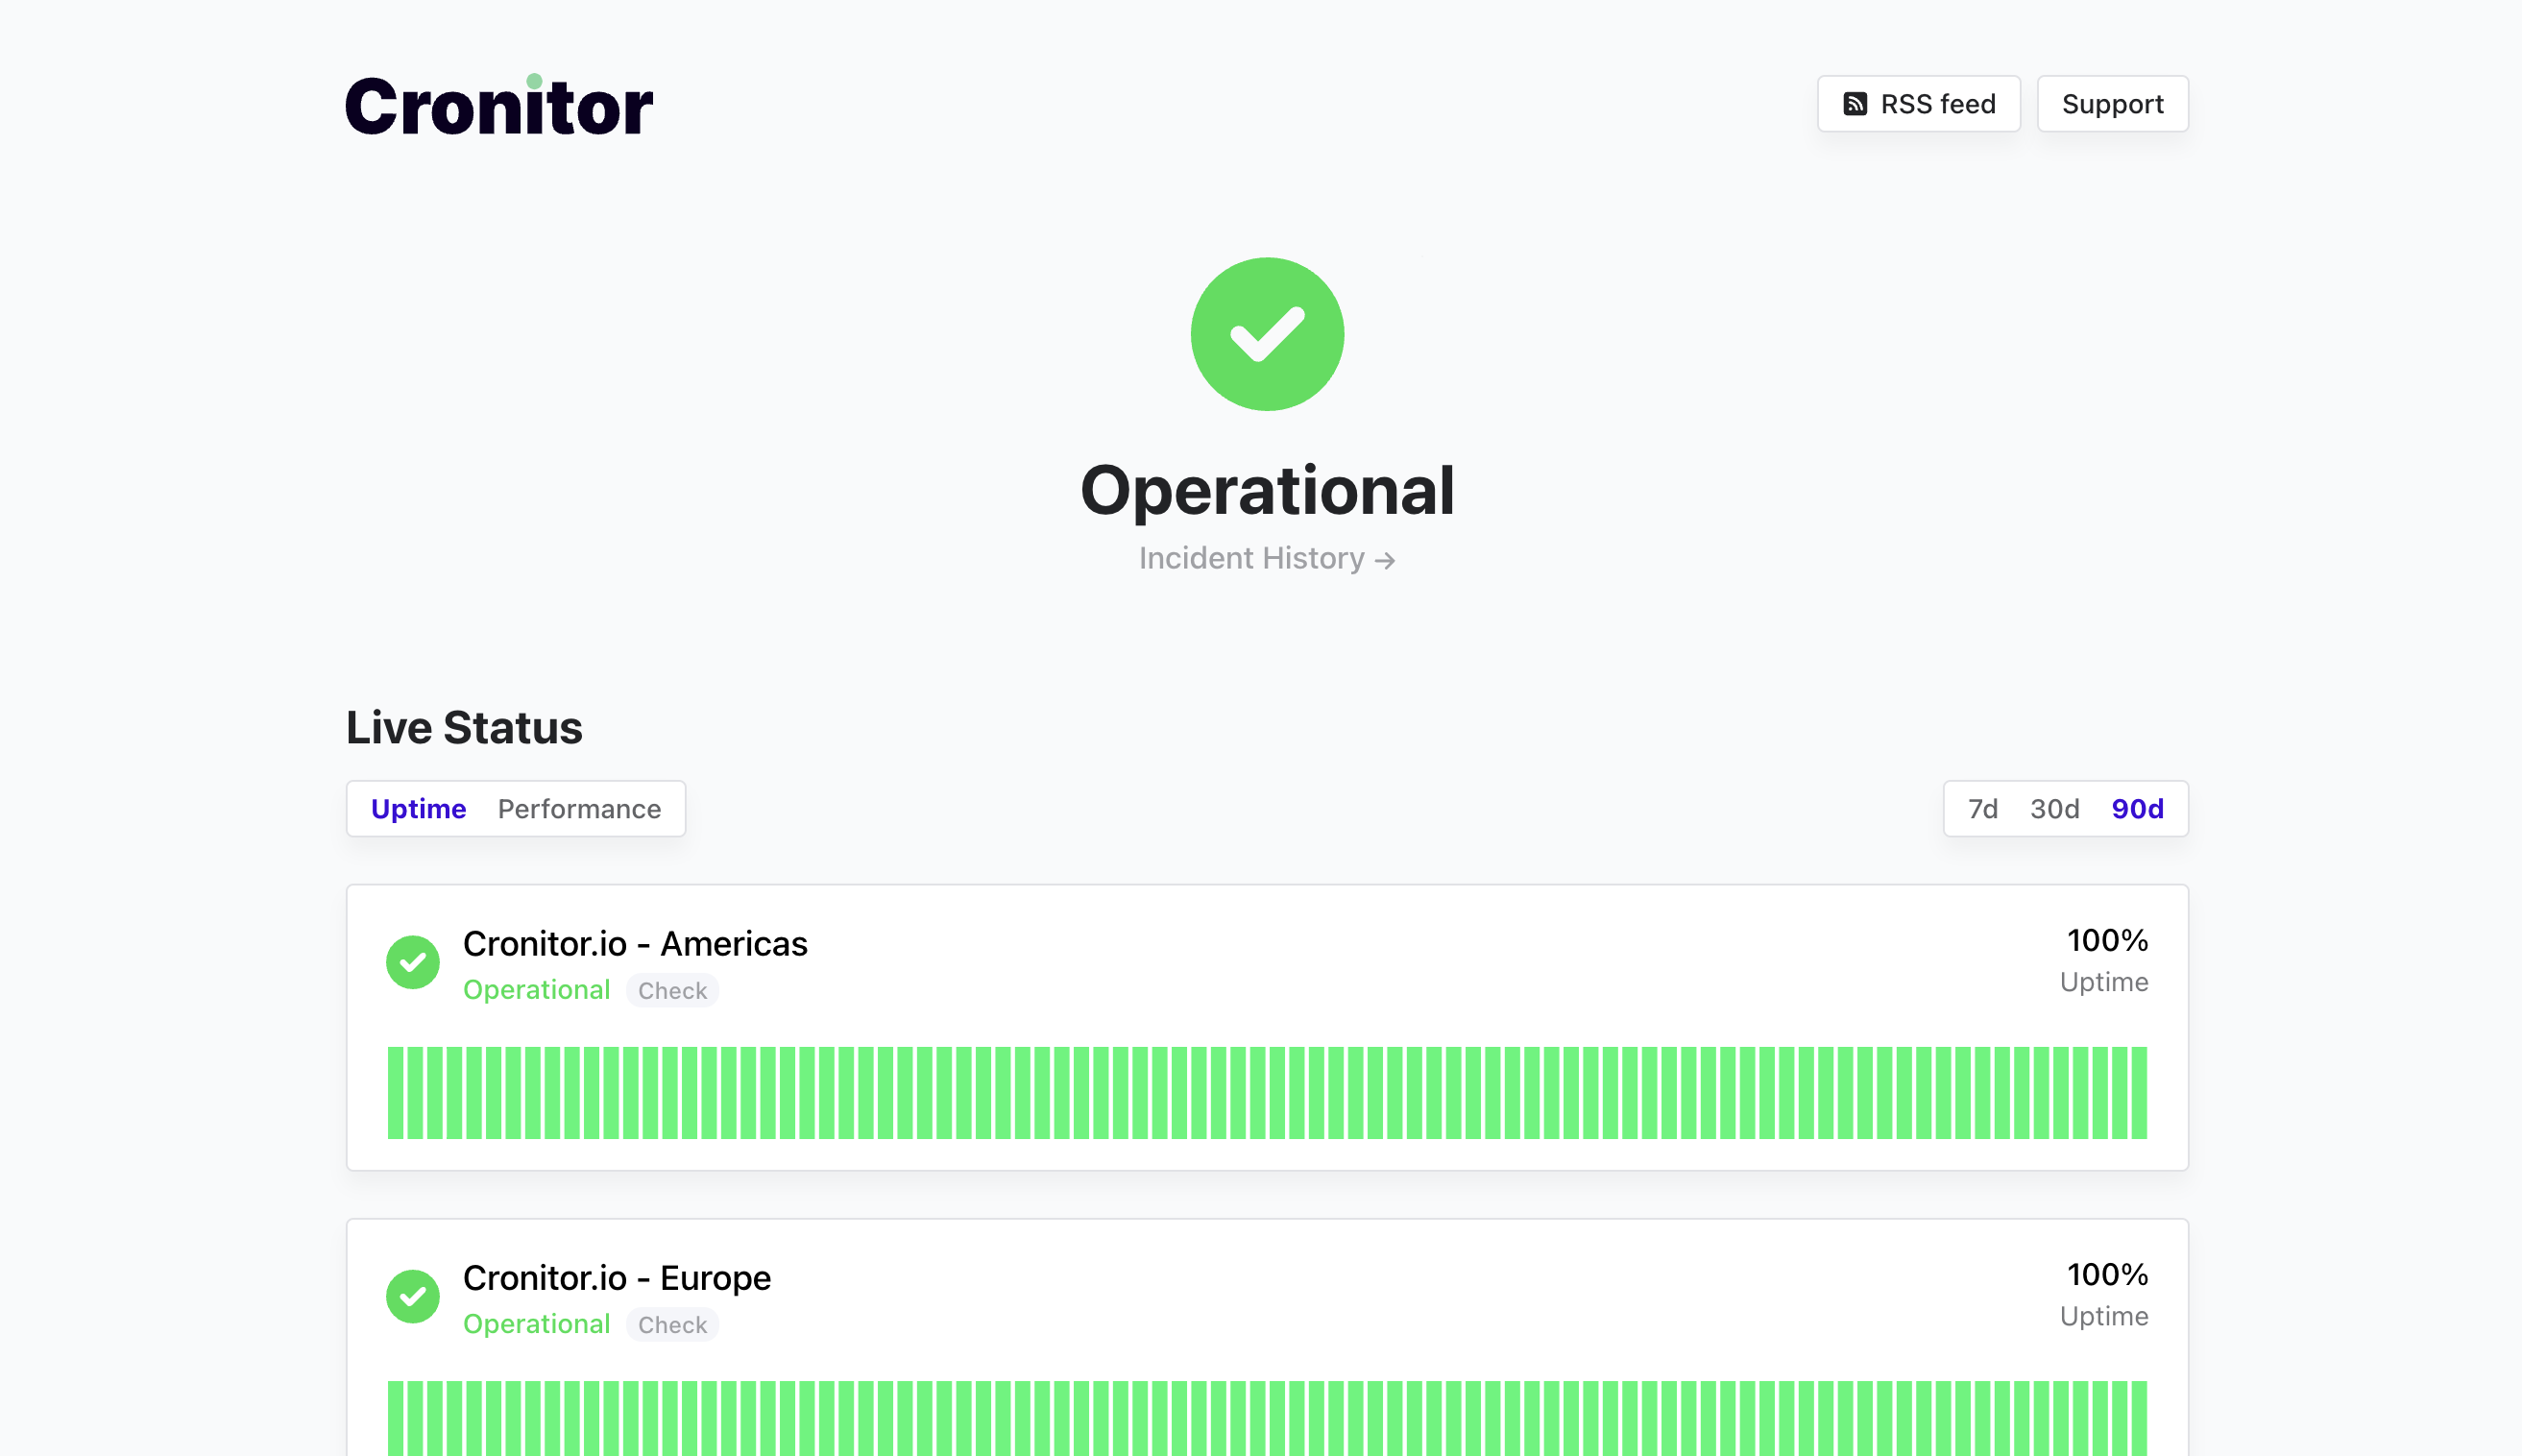
Check out our demo status page for a real-world example of what they look like in action.
Benefits of having a status page
A status page is of great help before and during downtime. Being transparent about how your team has handled incidents in the past is a great way to build trust.
When your service is up, they help you showcase historical reliability. During downtime, they help your team communicate status updates with all stakeholders.
Status pages enable your team to:
- Showcase your reliability. Help your users see how reliable and performant your services are. This builds trust and sets the right expectations on what your SLAs are.
- Share incident updates. Simplify incident management by publishing updates from one place. Your team doesn't have to use different platforms to communicate incidents.
- Automate incident creation and resolution. Monitoring platforms - such as Cronitor - create and resolve incidents for you. This frees up time for your team and ensures the status on your page is always accurate.
- Reduce support tickets. Be transparent about past and ongoing outages. Your customers can answer their questions without going through support first.
It's not only tech-savvy customers that find them useful. More than ever our daily interactions happen over the internet and downtime happens. That's why many users now look for a company's status page whenever they think there's an issue.
Let's see it in action. Next, we'll create a status page and cover some of the most common use cases for it.
Create your first status page
We're using Cronitor to create our example status page. It's a simple monitoring platform for your websites, APIs or cron jobs. The free tier includes up to 5 monitors and a basic status page, so feel free to follow along.
To start, open your Cronitor dashboard and on the left-side menu, click on Status Pages.
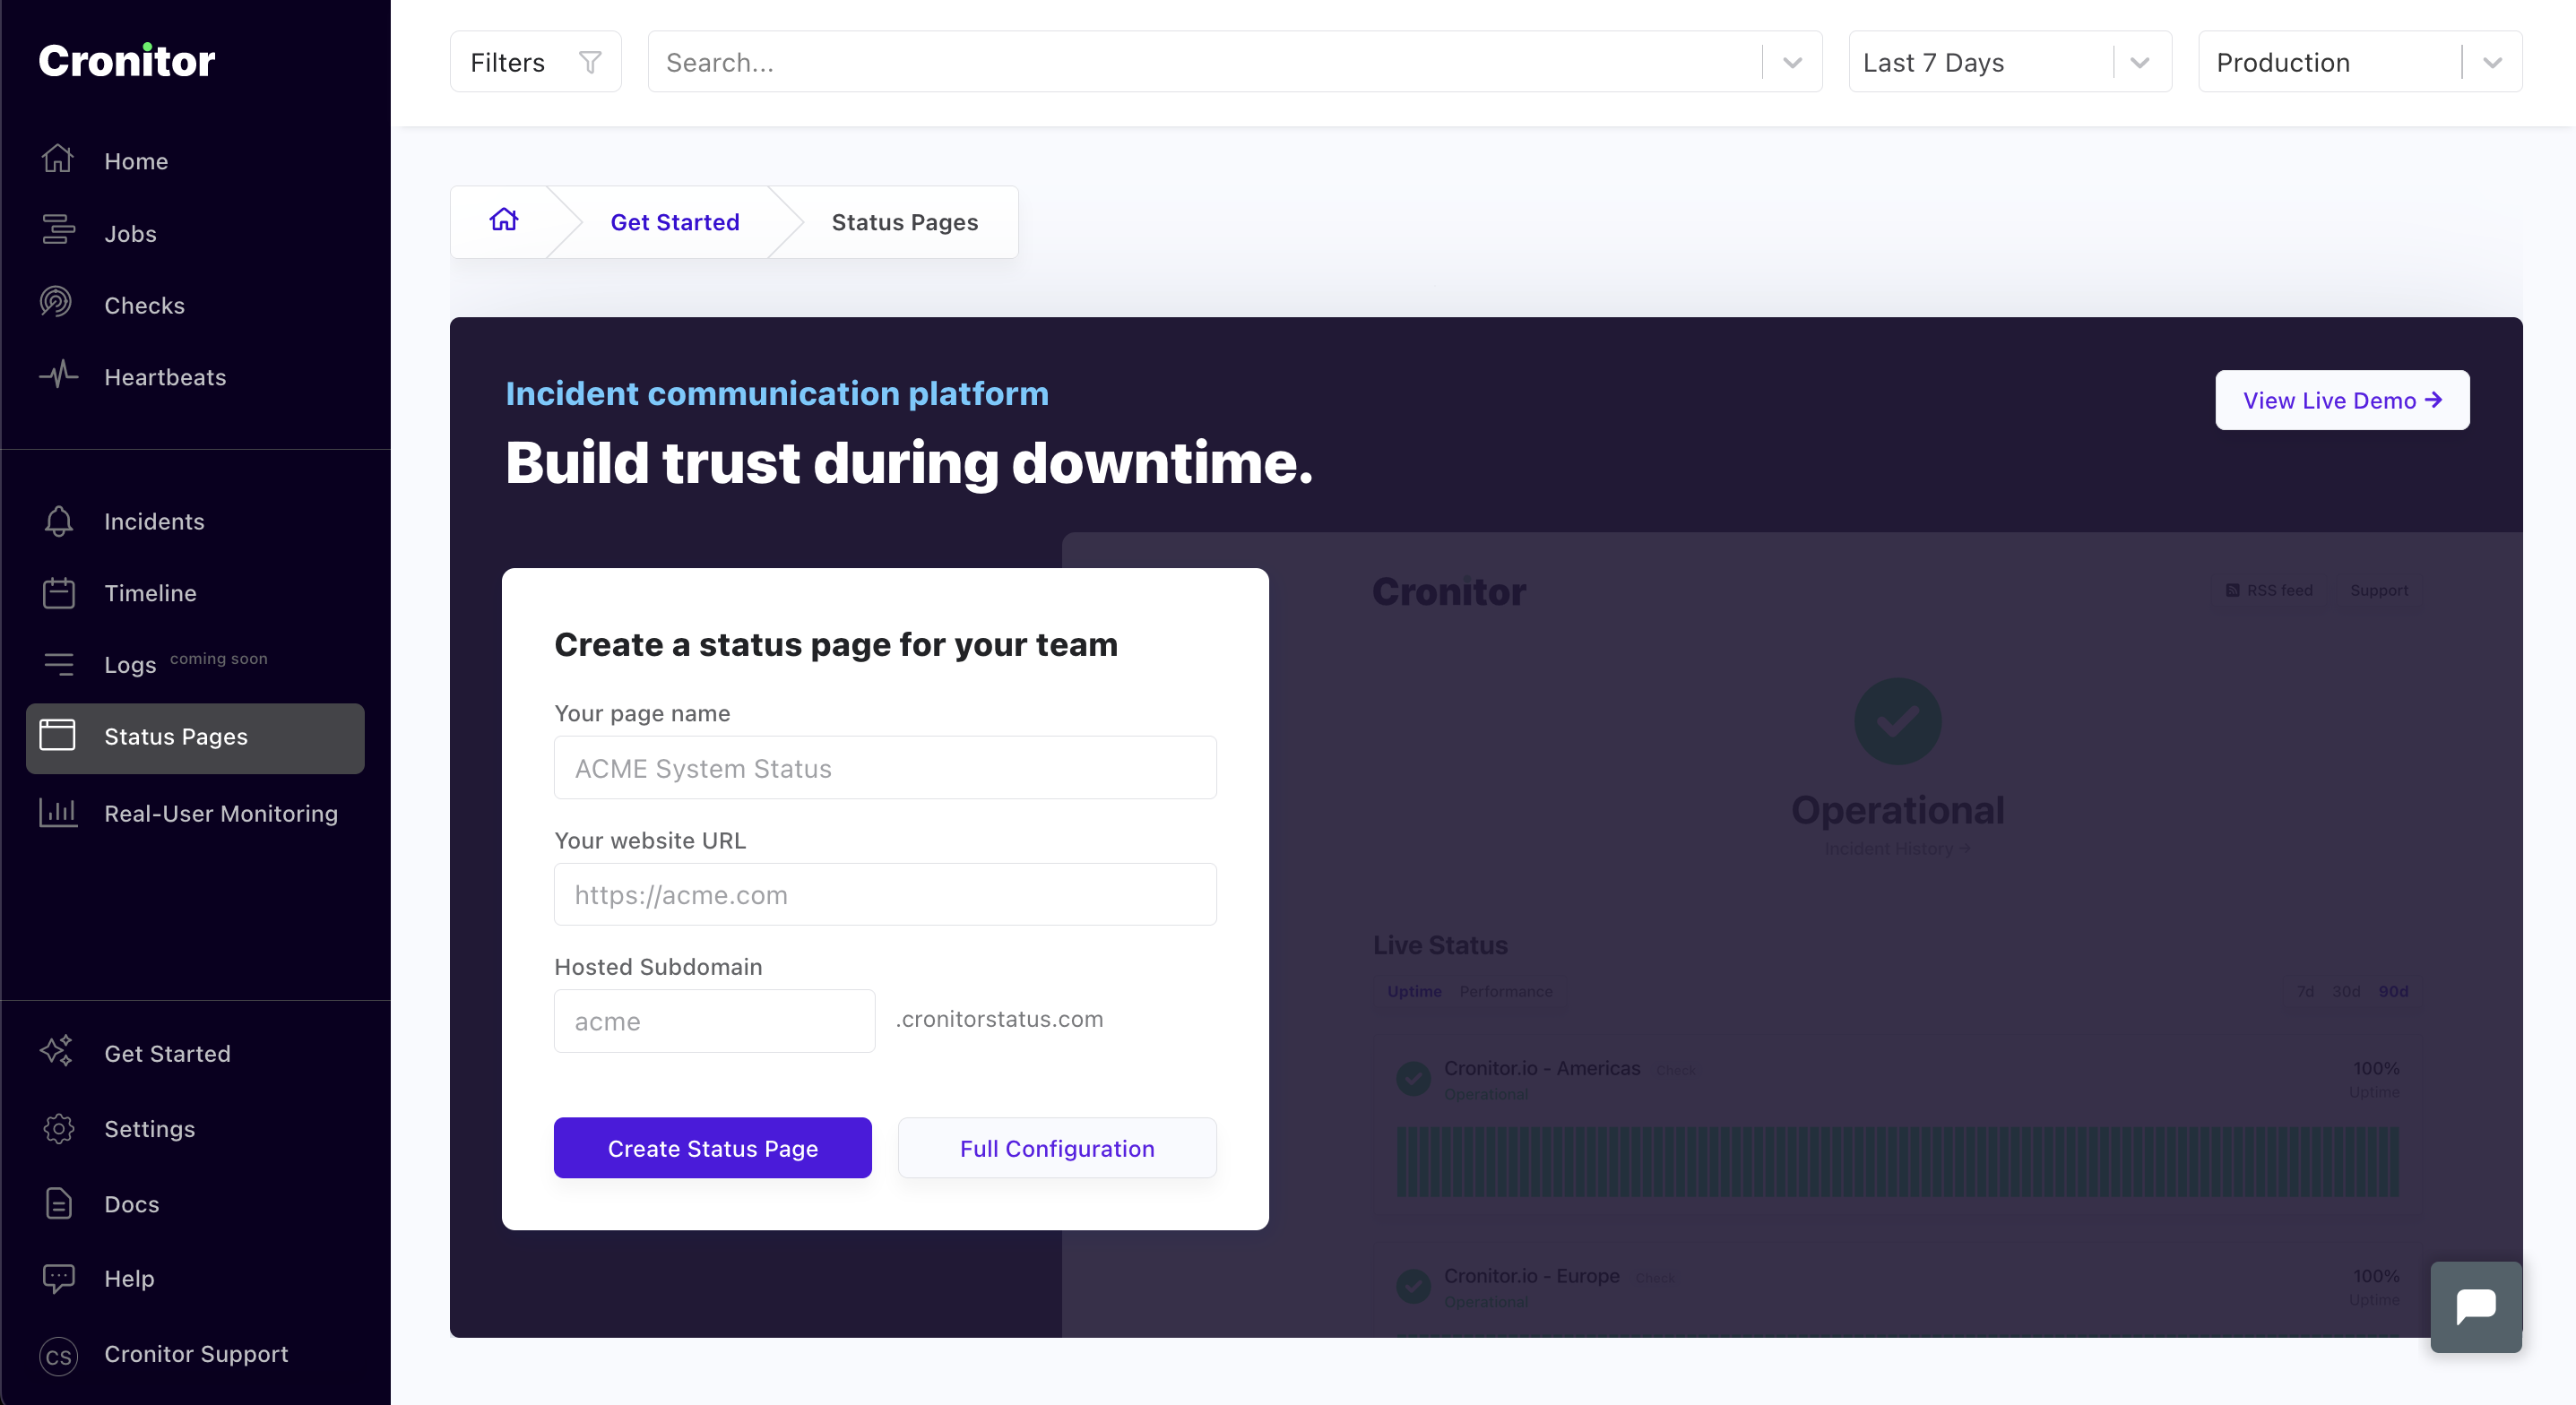
You can name your status page anything you'd like. You're asked for your website URL so that users can find your official website too.
You should also pick a hosted subdomain of your choice. This is important as it enables you to view and share the status page right away. Note that the subdomain should be unique across all status pages on Cronitor.
Click on Create - the status page is live!
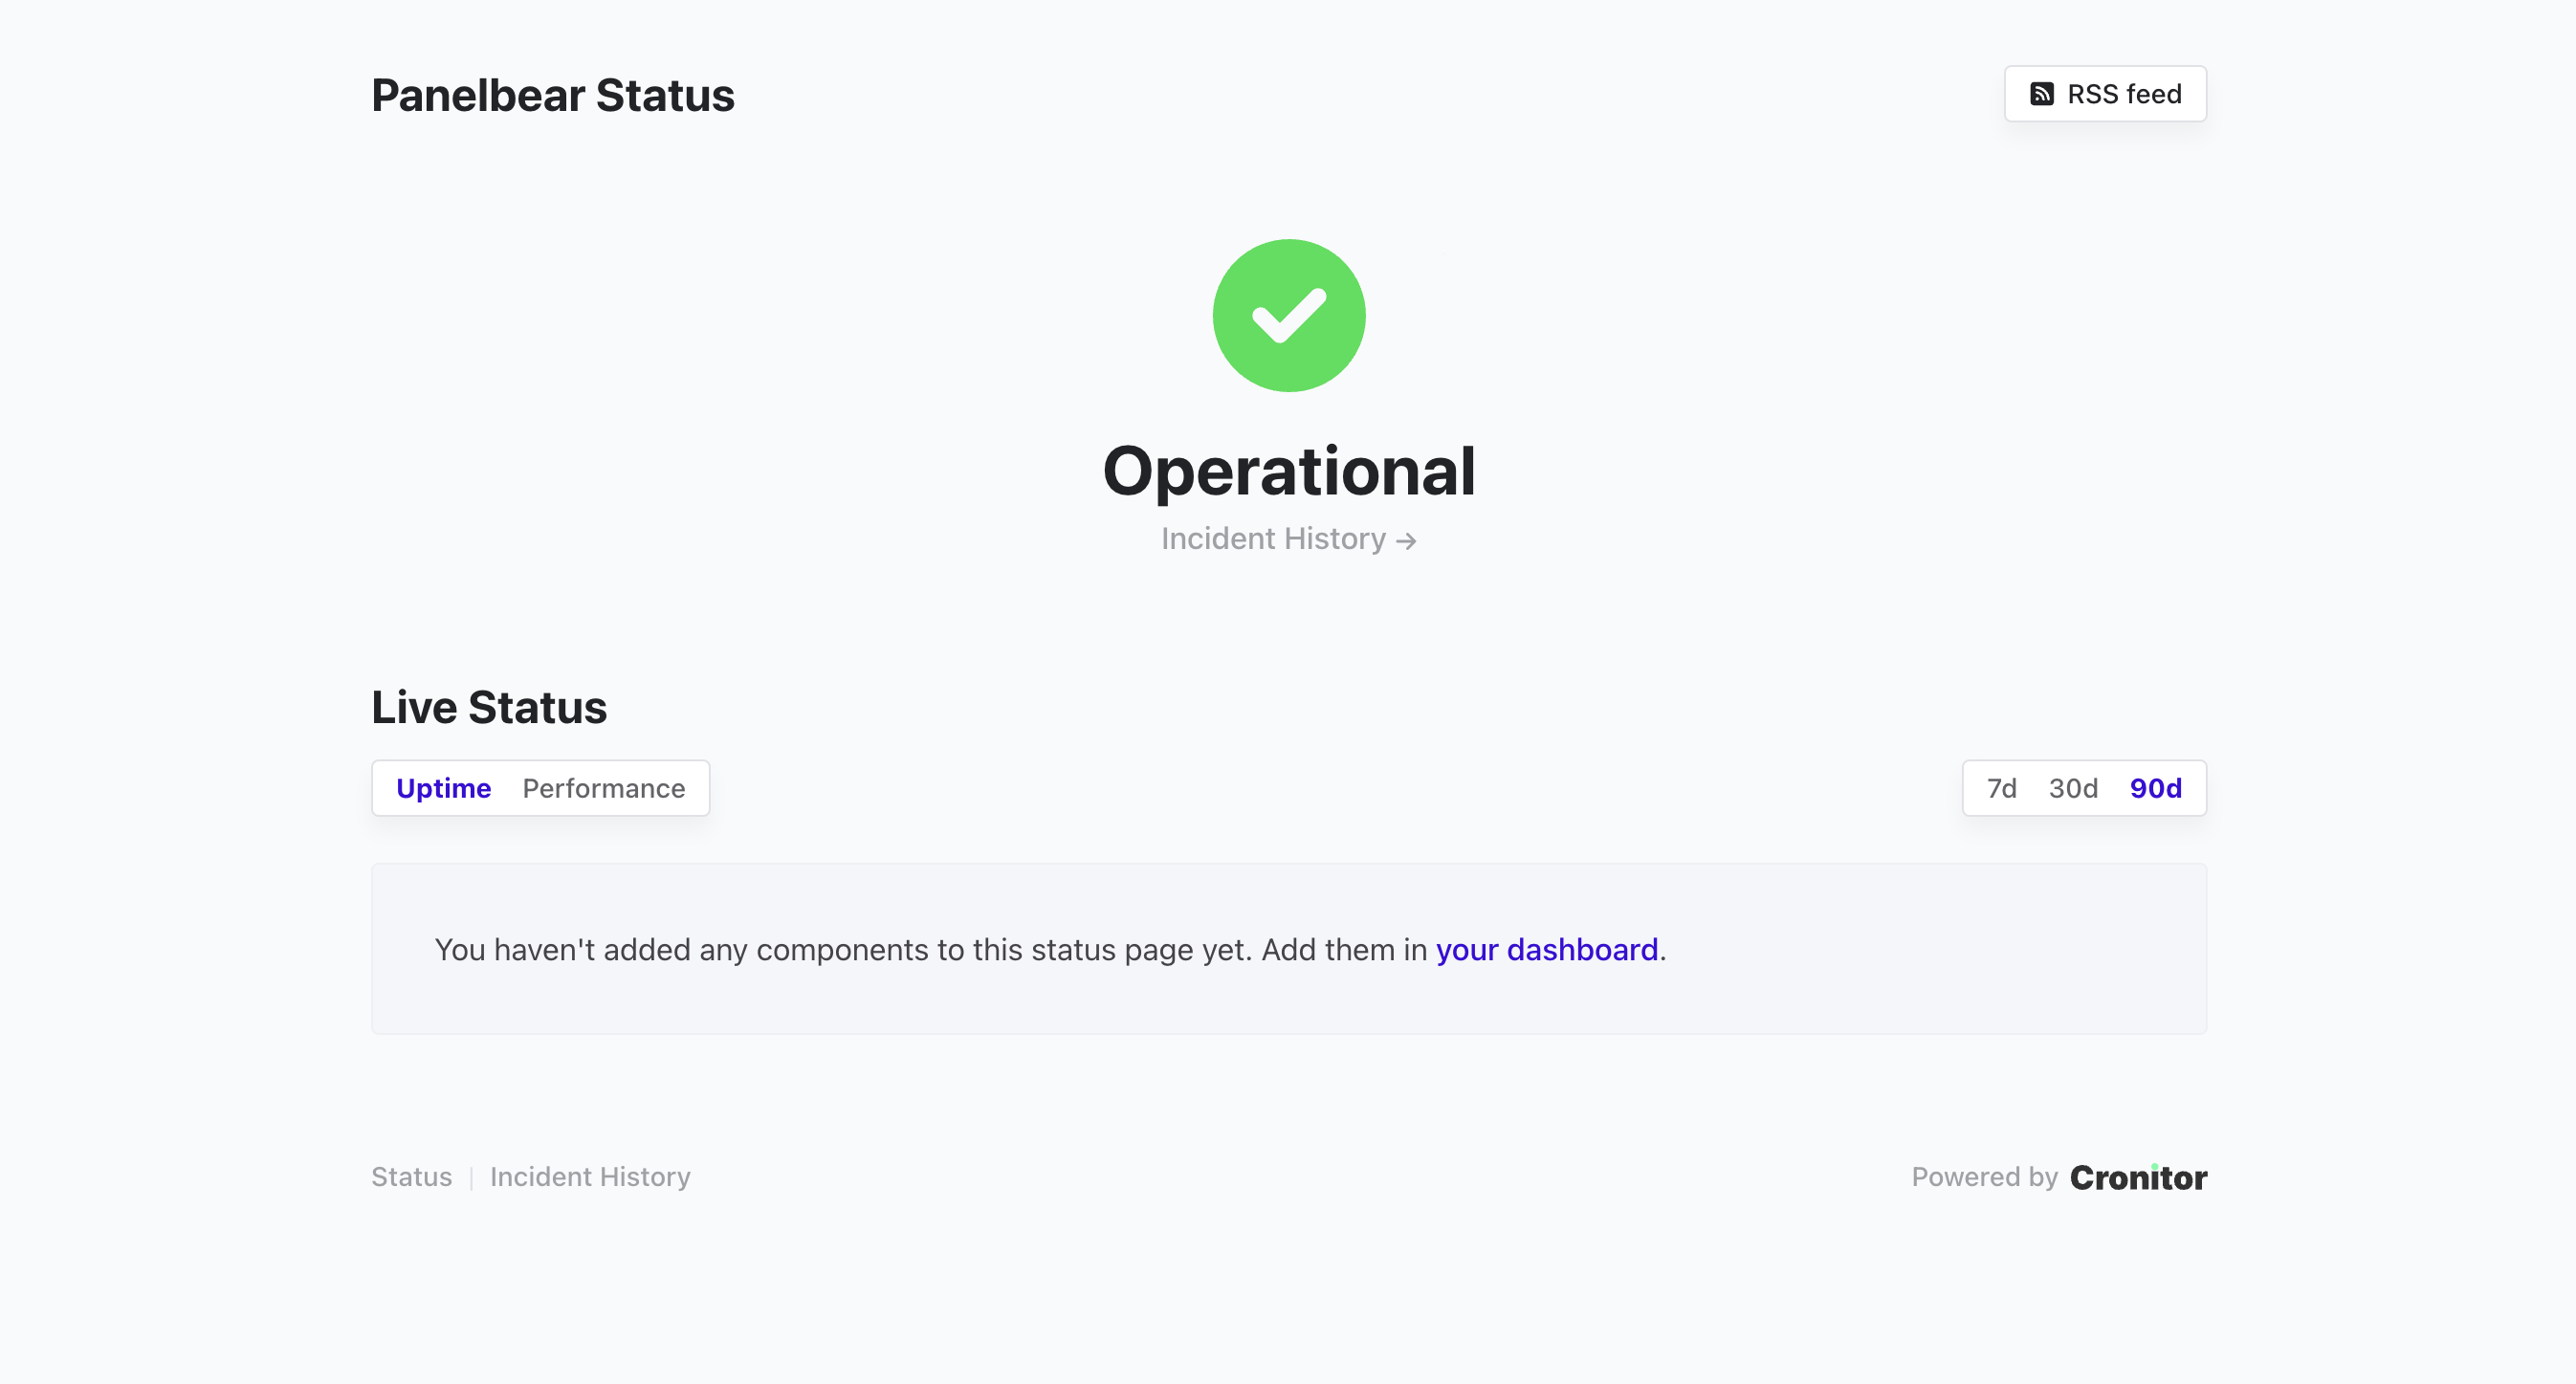
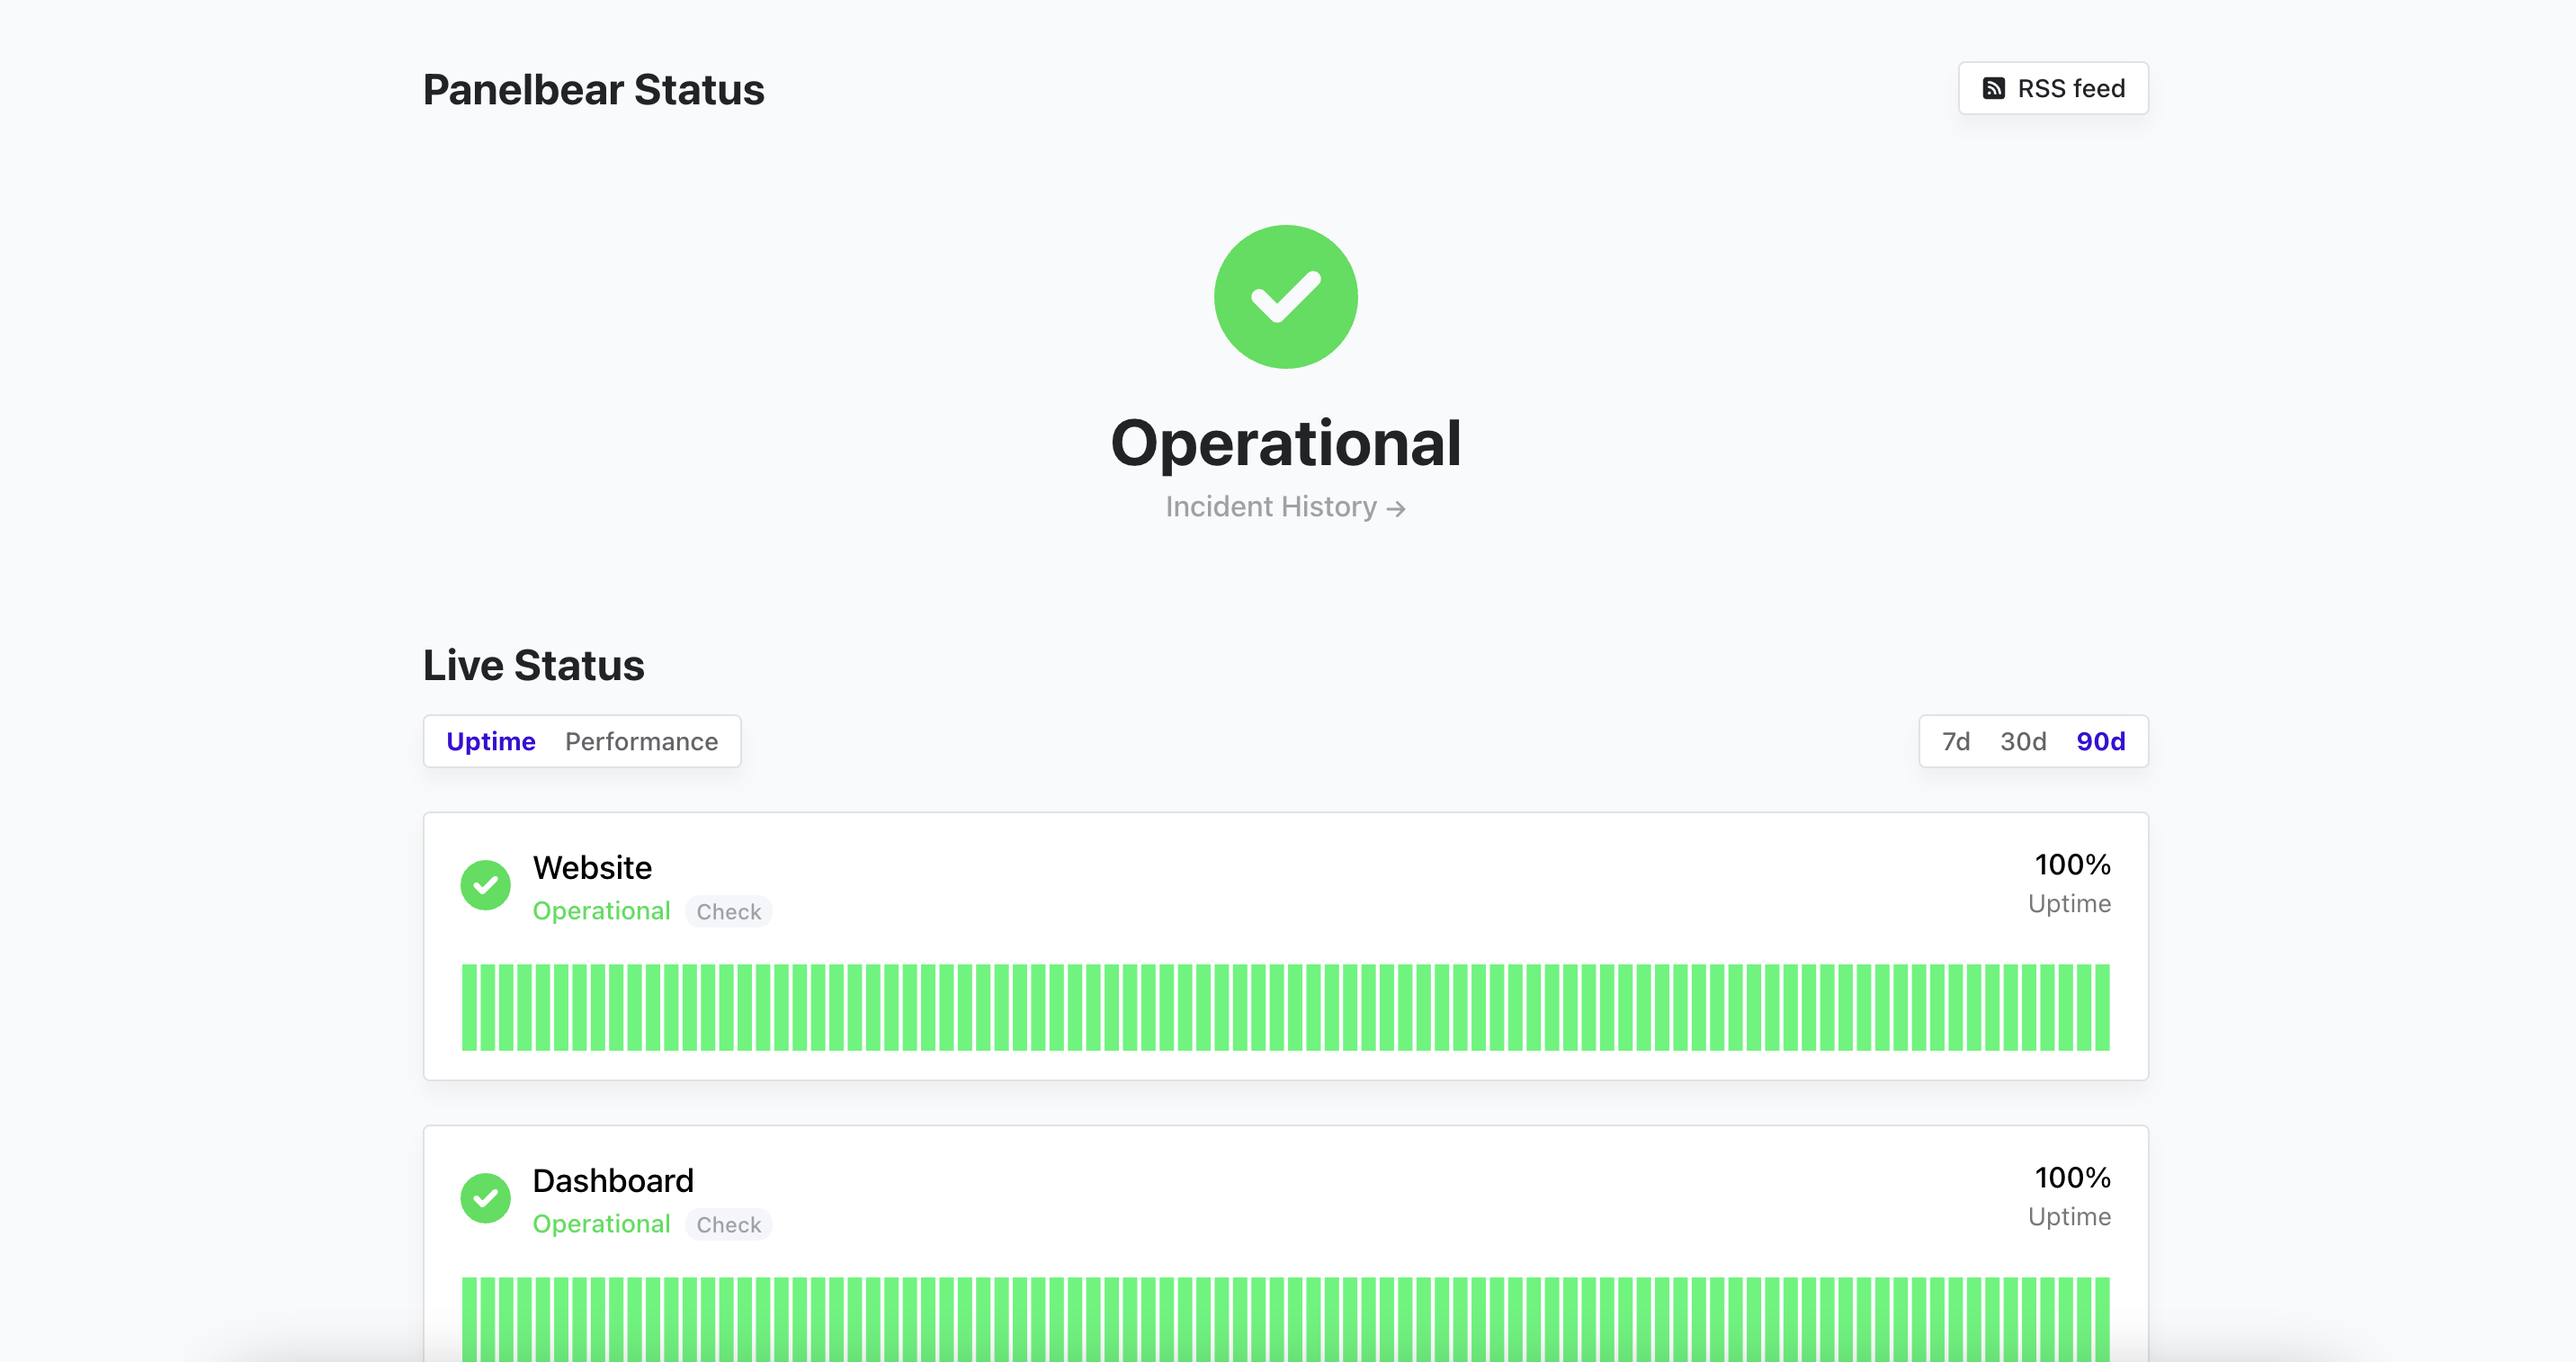
You can preview it by clicking on the View Status Page button on the top right side of the screen. You can always access it via the hosted subdomain you picked earlier. For example: panelbear.cronitorstatus.com.
Right now our status page is empty. Let's fix that by adding some page components.
Add page components
Next let's add some components to our status page. A component could be a check, job, heartbeat or even a group of monitors. You should create a few monitors if you haven't already so you can attach them to your page.
Once you have created some monitors, head back into your status page admin panel. Click on the “Add any monitor or group” search box to open the dropdown.
This dropdown lets you attach any existing monitor as a component to your status page. Let's pick a few of our monitors so that our status page is not empty.
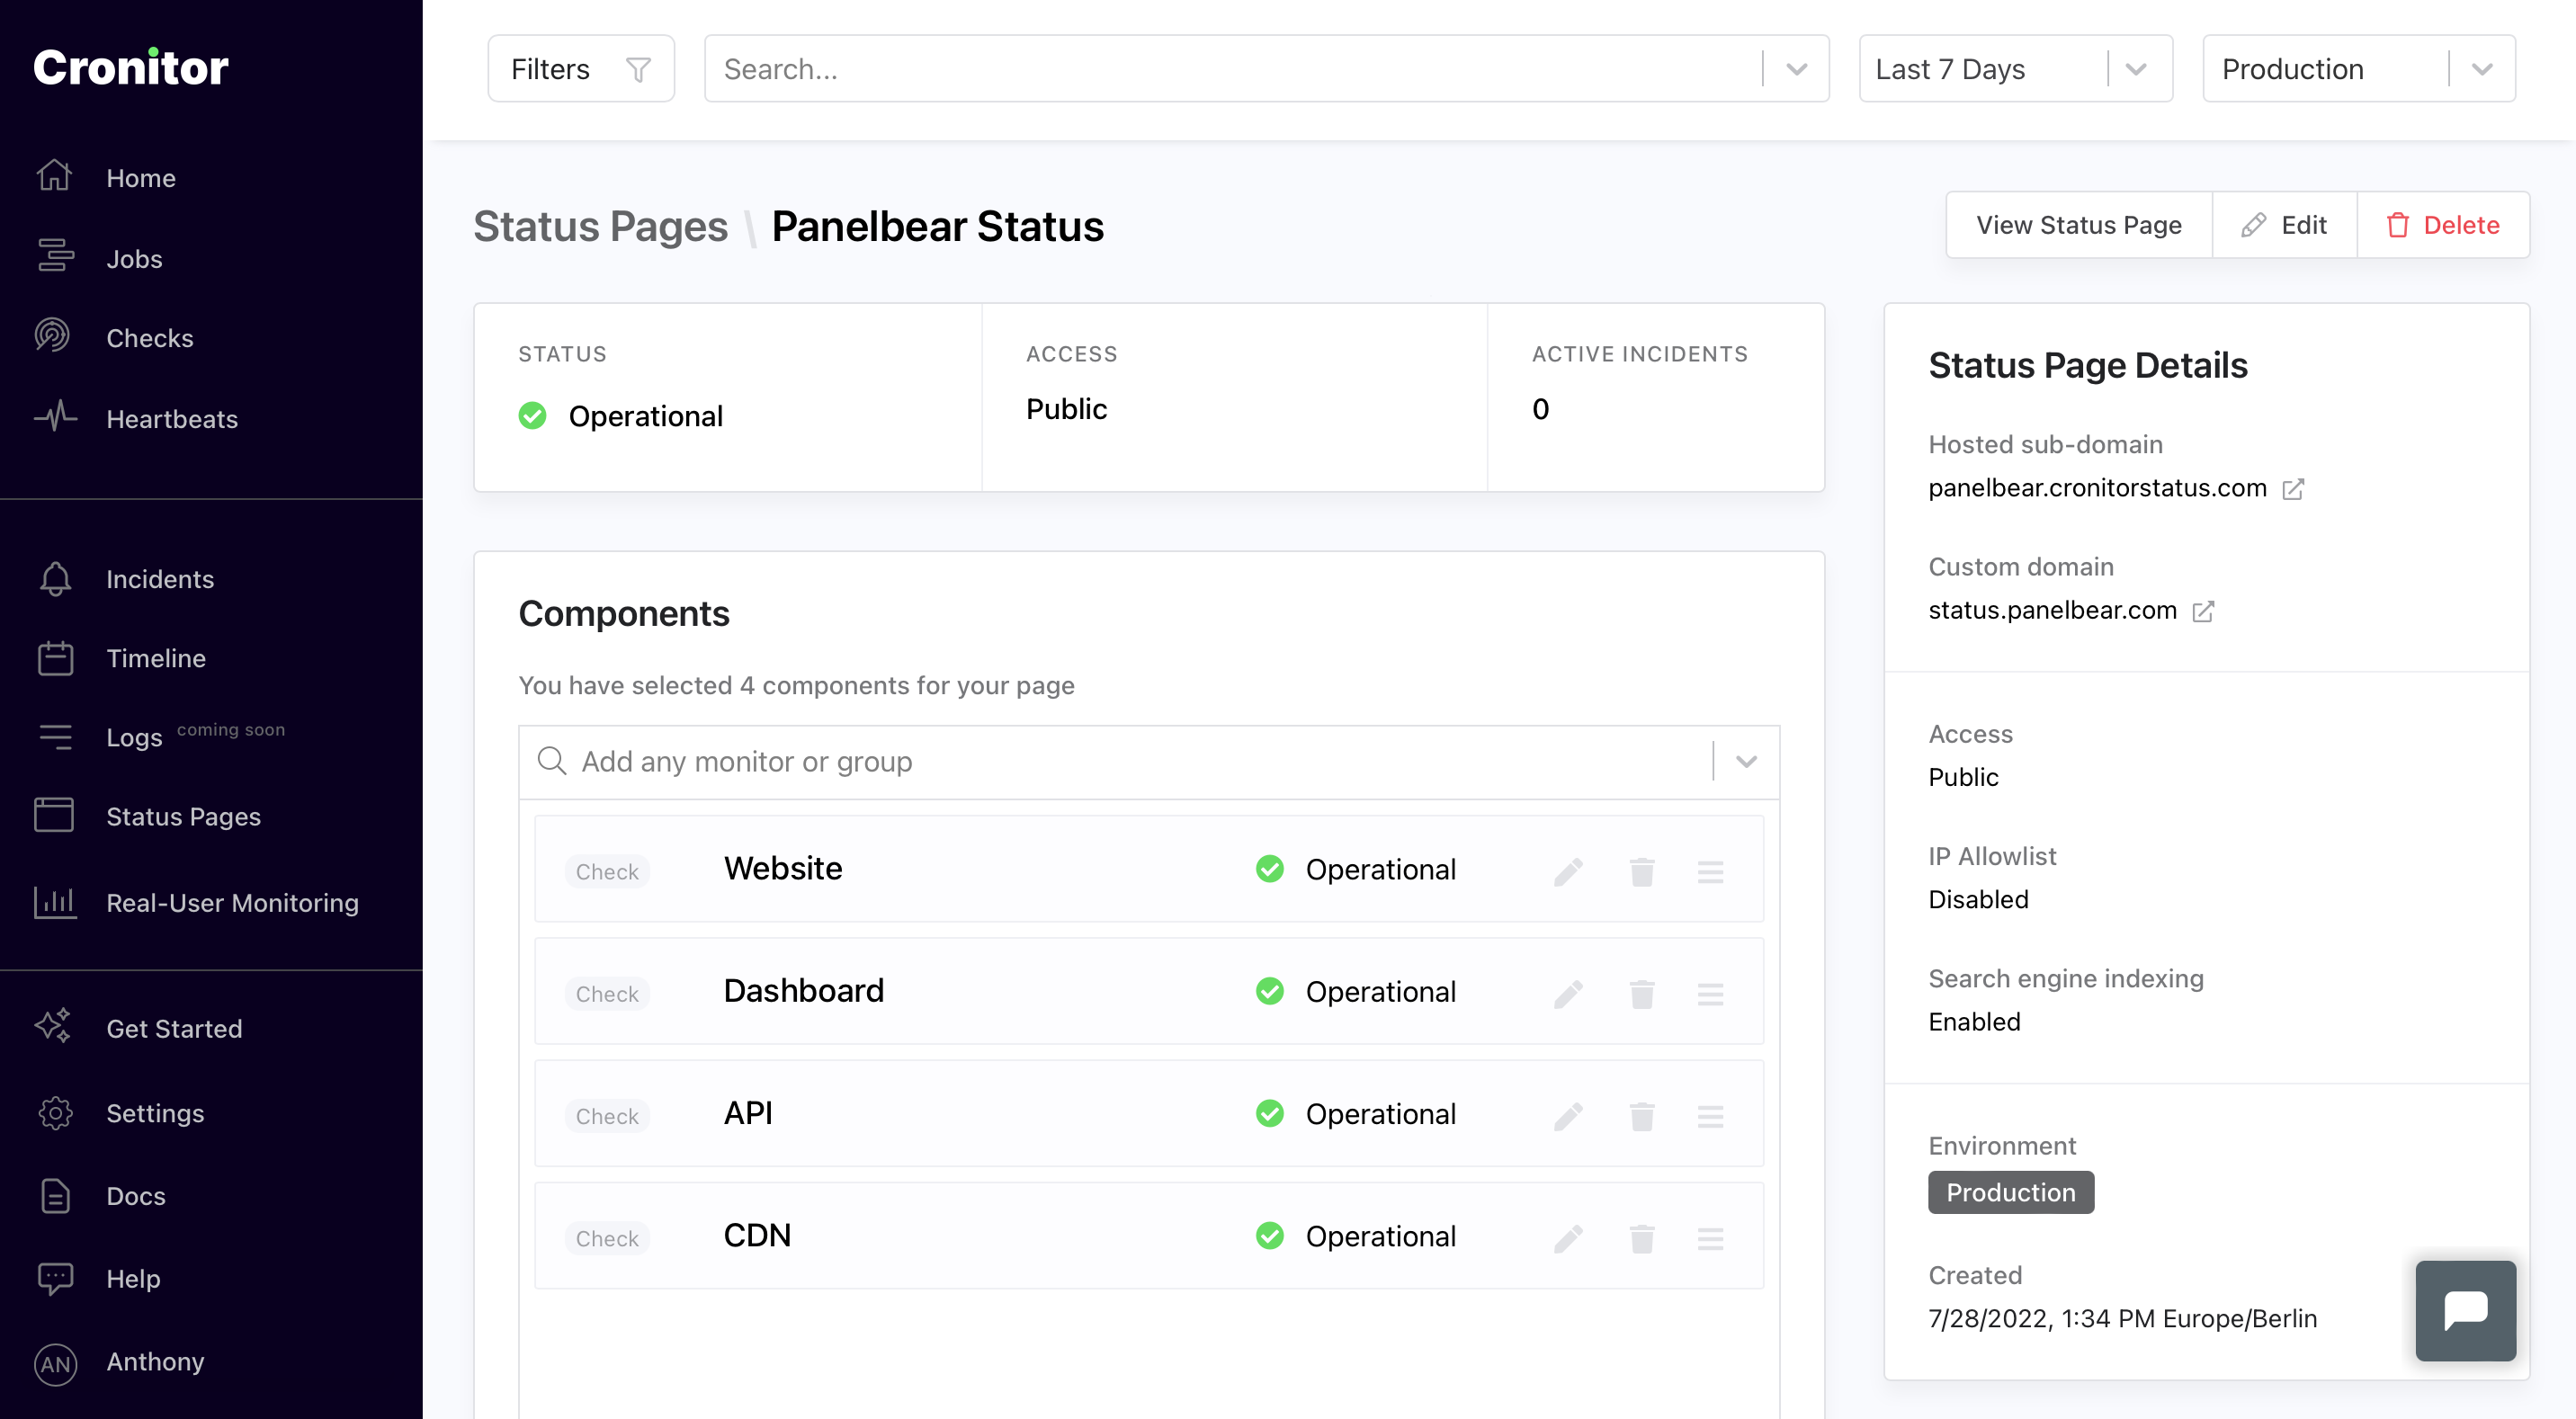
You can re-order and rename the components as you'd like. Renaming is useful in case you'd like to have more control over what's presented to your end users.
Finally, let's check out the status page with the components we added.
Publish your first incident
Now that we have created a status page, let's publish an incident to it to see how it all comes together.
To start, go to your Cronitor dashboard and head into the Incidents page. Click on "Create Incident", you should now see the incident form.
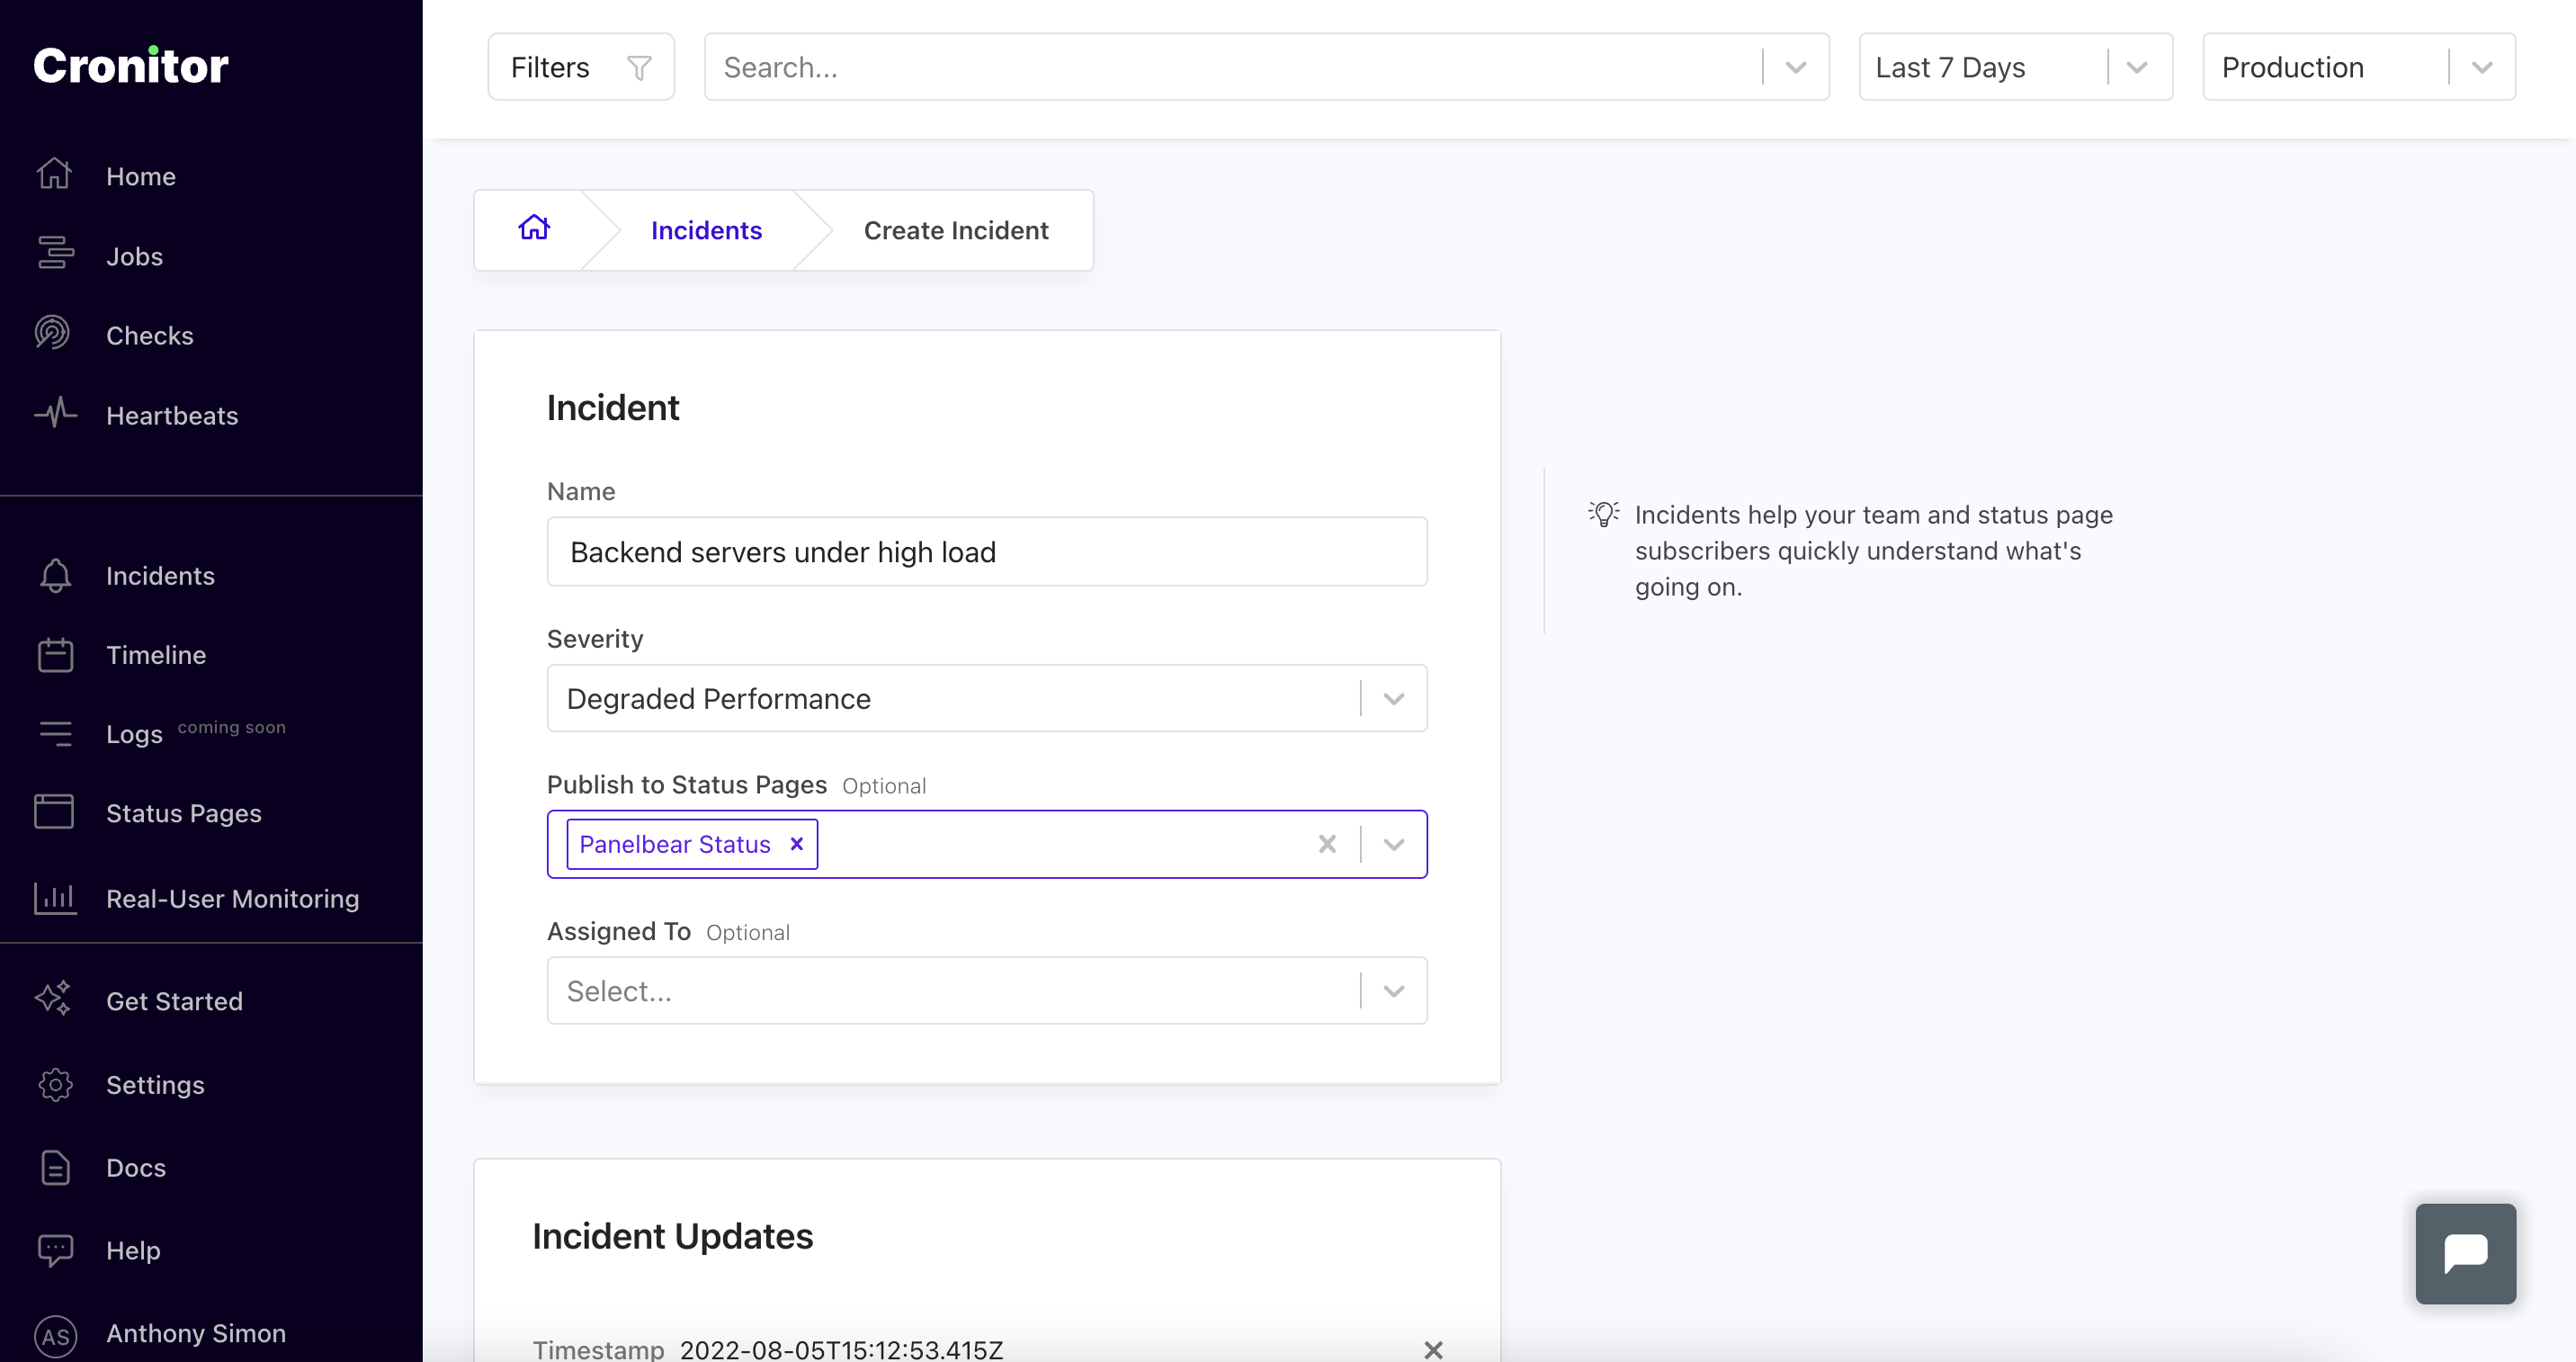
Fill in the incident details. Don't forget to select your status page in the Publish to Status Page dropdown. In case you'd like to publish to several status pages too, you can select them here.
Under Incident Updates you can add any relevant updates. For example, when your team is investigating an incident, they could create update such as:
"Investigating: We have detected a server outage, the team is investigating the issue."
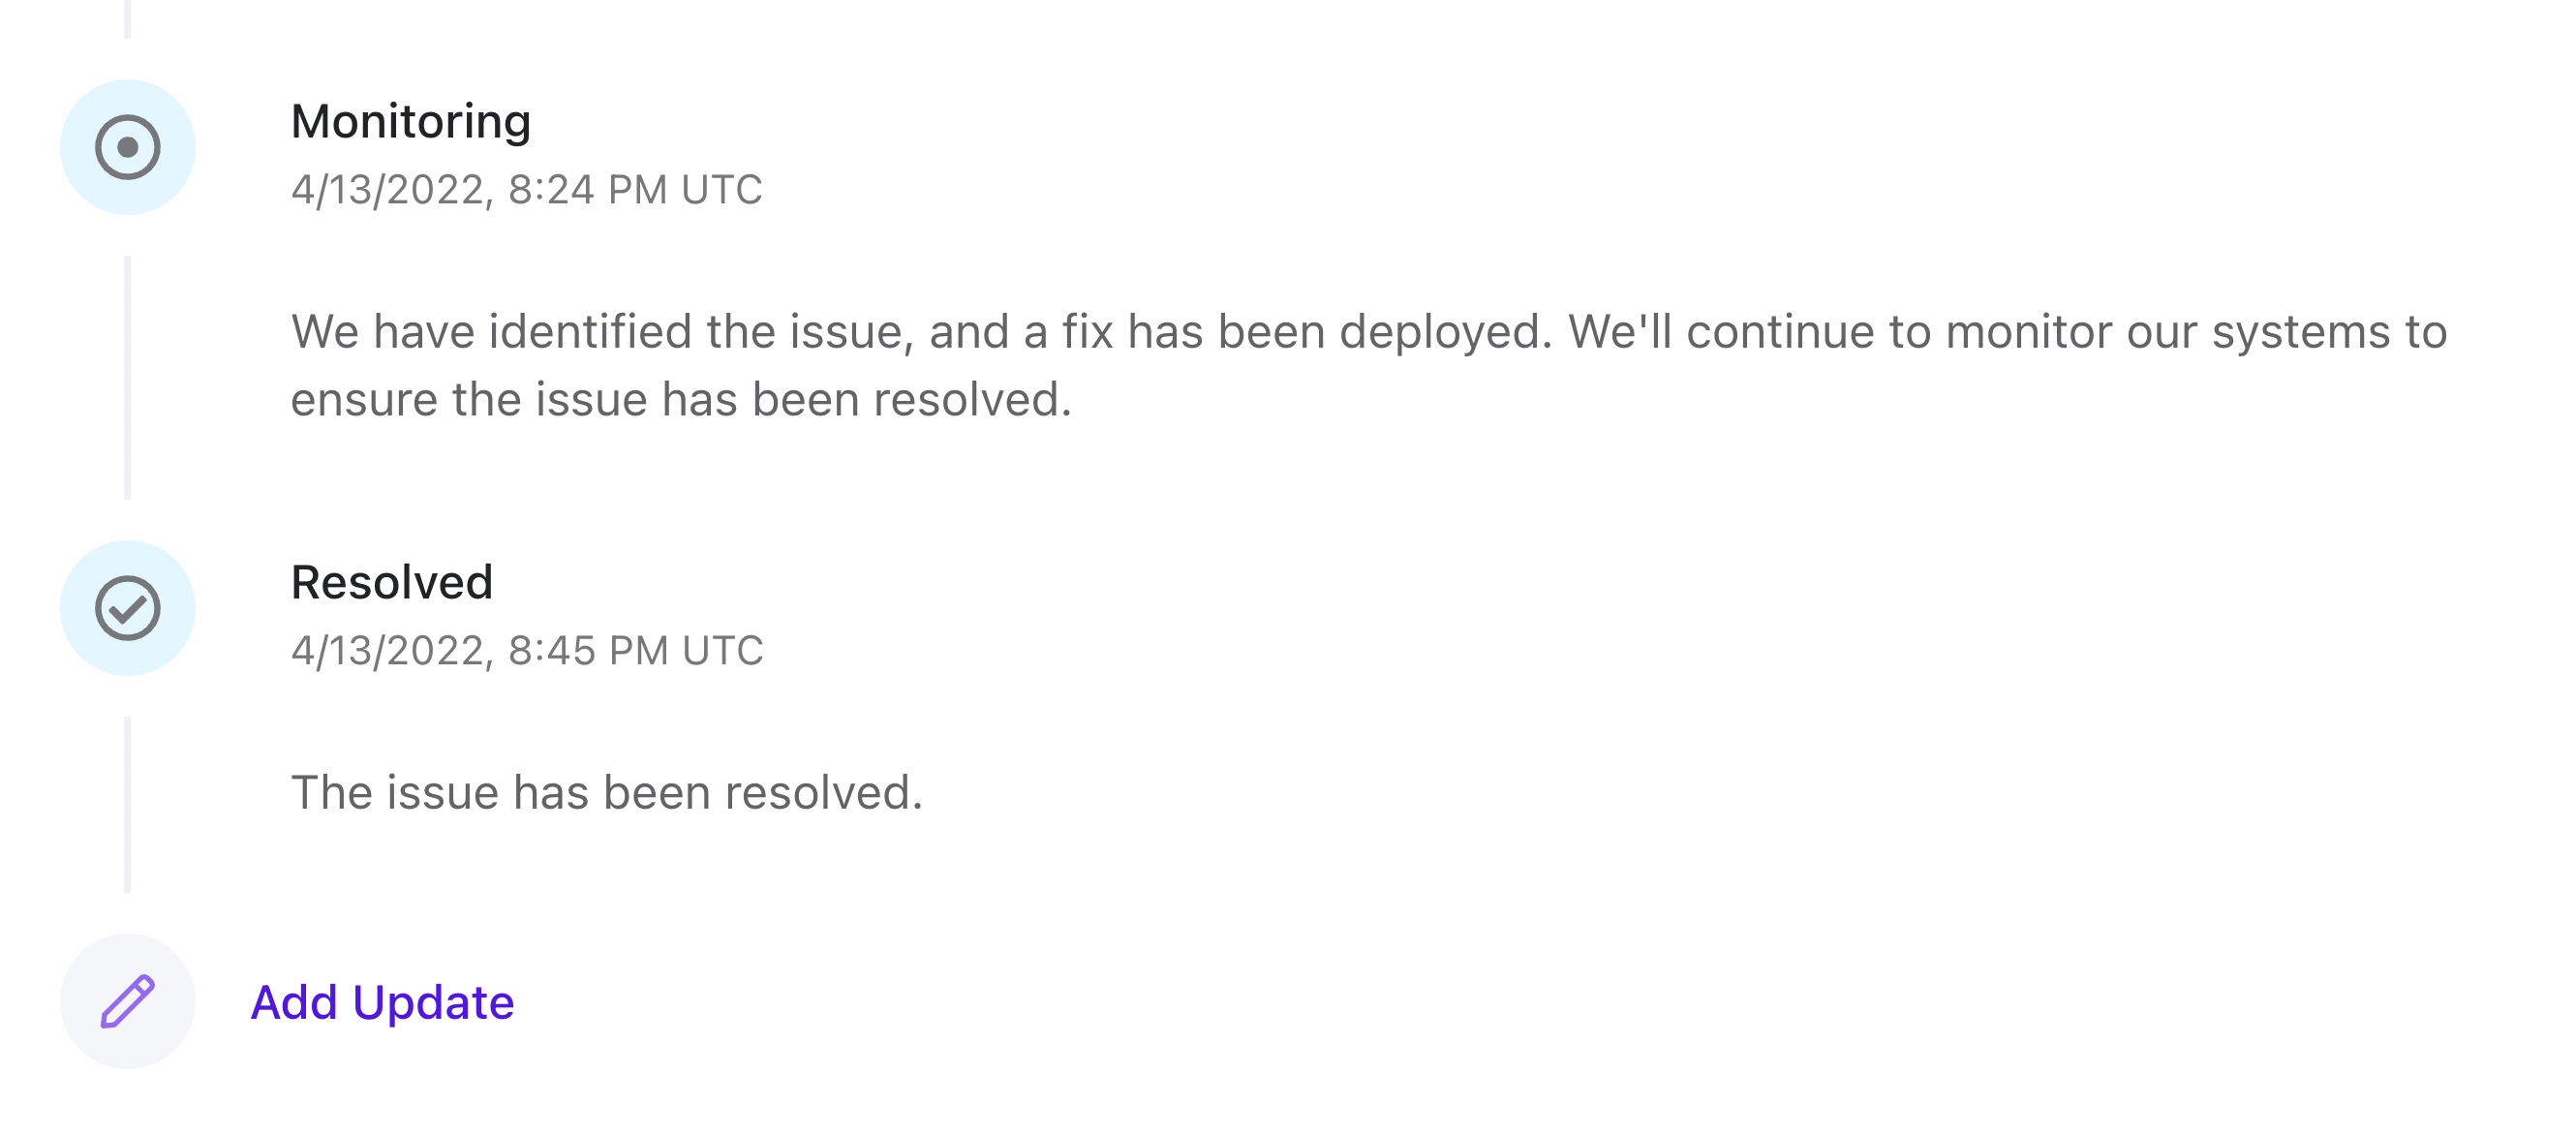
Once your team finds the issue and deploys a fix, they could publish another update:
"Monitoring: We identified the issue and deployed the fix. We're monitoring the servers to ensure the incident has been resolved."
This helps your users understand the current status of an incident as well as the timeline of events.
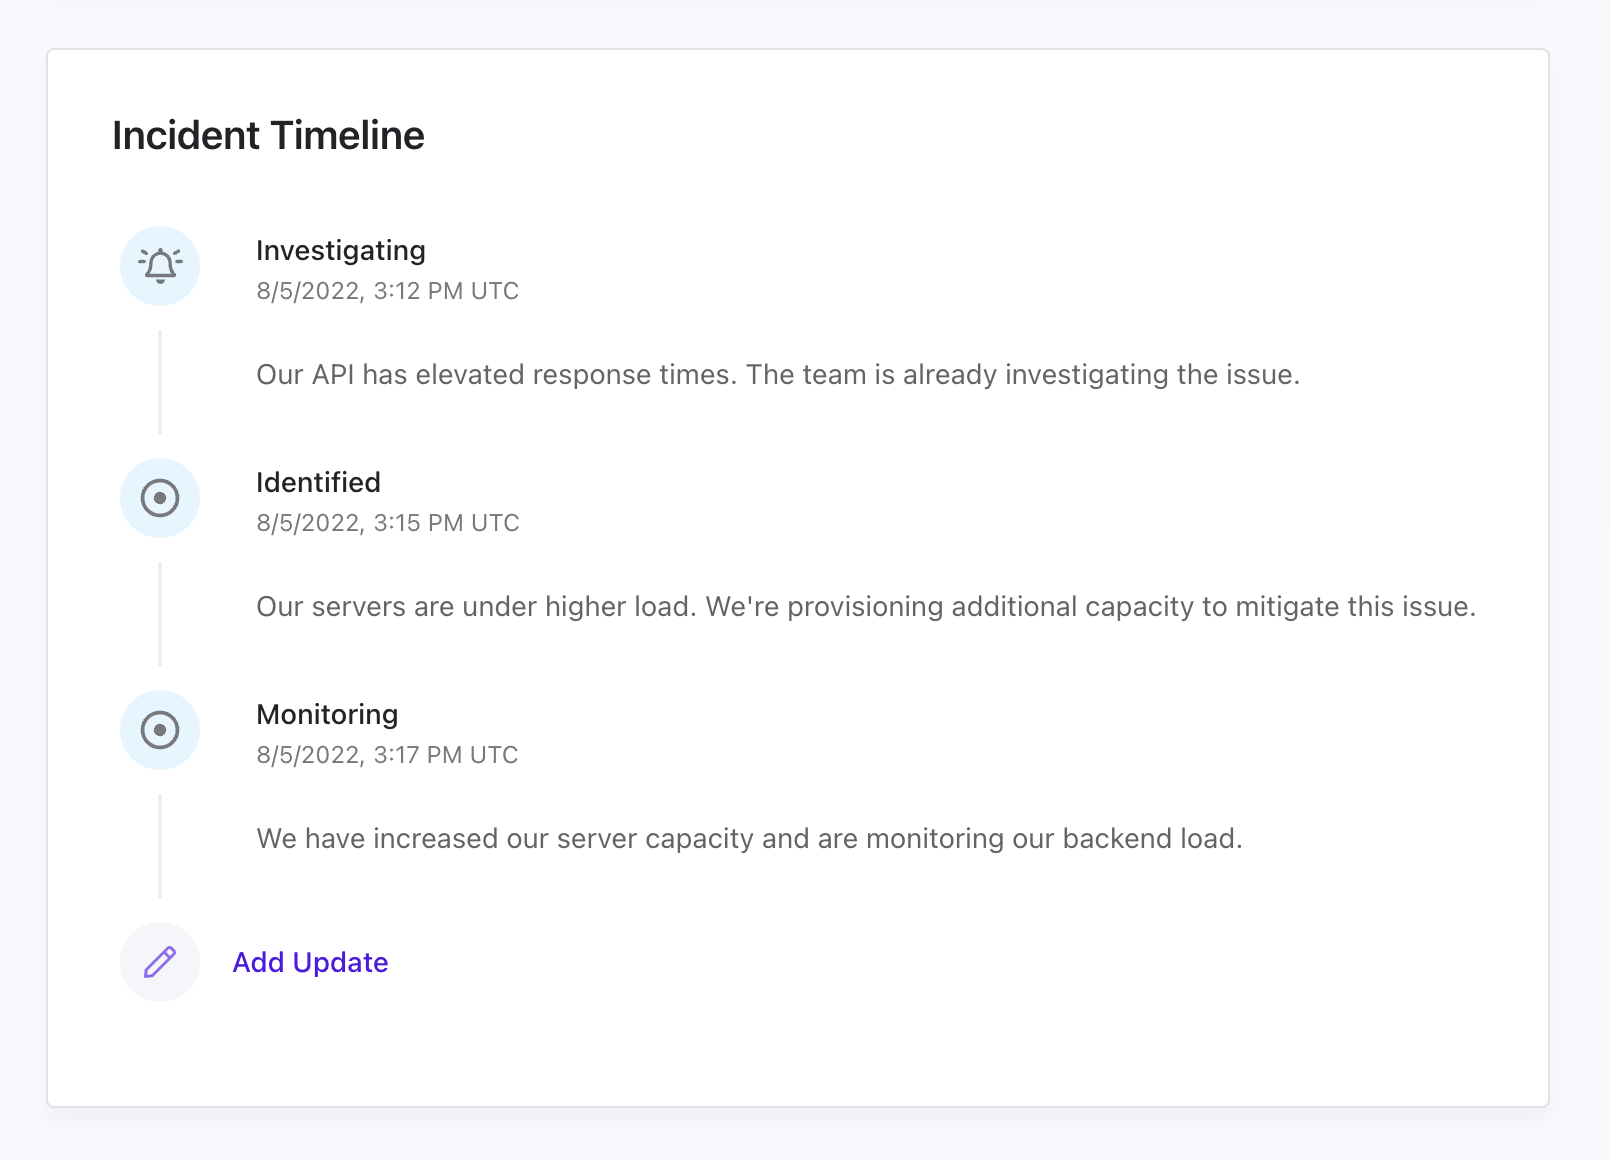
Once you've added any incident updates you deem relevant, hit Save.
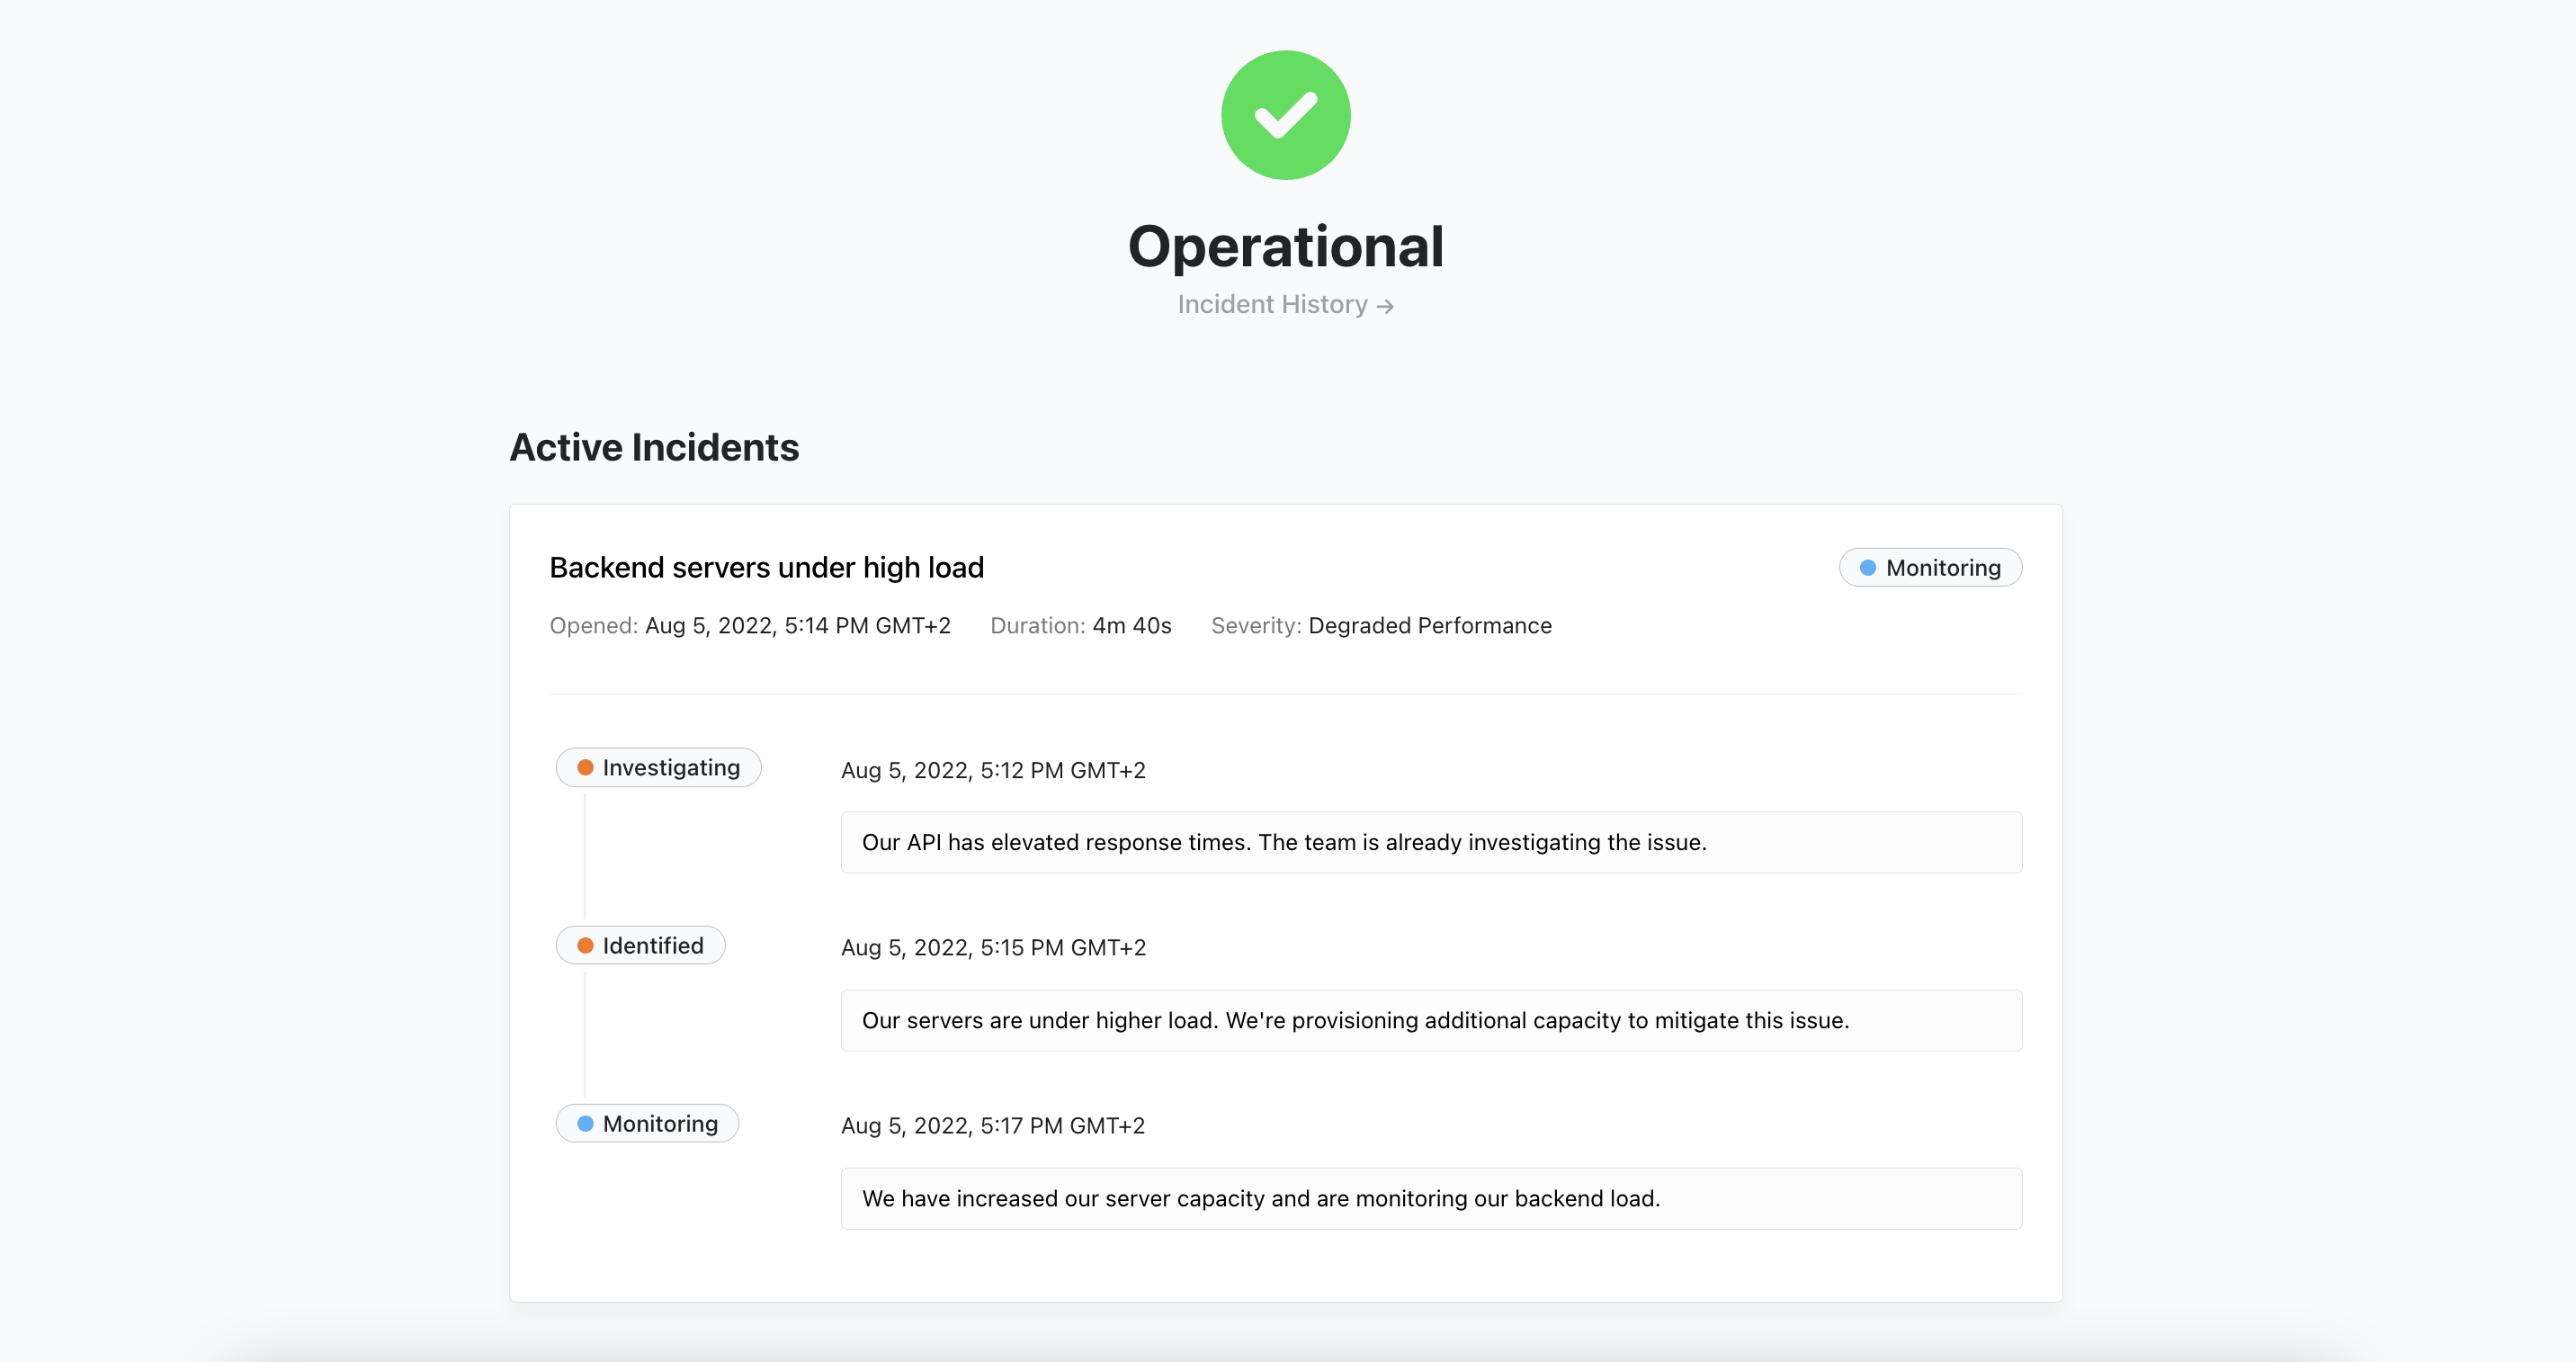
Next, open the status page. You should be able to see the active incident at the top of the page.
Resolve an active incident
Next, let's resolve the incident so our users know we resolved the issue.
Click on the one we created earlier, then Edit and add an update with the status “Resolved” to close this incident. You can optionally provide a description of the update.
The incident will no longer appear at the top of the status page. But we can always find it again in the incident history page.
Cronitor comes with built-in active monitoring and automated incidents. It can open an incident whenever your site, API or cron job is down. It will also resolve the incident when the monitor becomes healthy once again.
Automated incidents are not published to status pages by default. This gives you total control over what you communicate to your users. They are only visible to your team in the Cronitor dashboard. In case you'd like them to appear on your page, you should attach them manually.
Of course, you can publish an incident manually as we did earlier. An incident doesn't have to have originated from an existing monitor. This is useful when you want to publish a general outage, or maintenance window.
View past incidents
Your status page also makes it possible to view past incidents. This is useful to show how your team handled a previous outage and to be able to share incident details.
To view past incidents, go to your status page and click on Incident History.
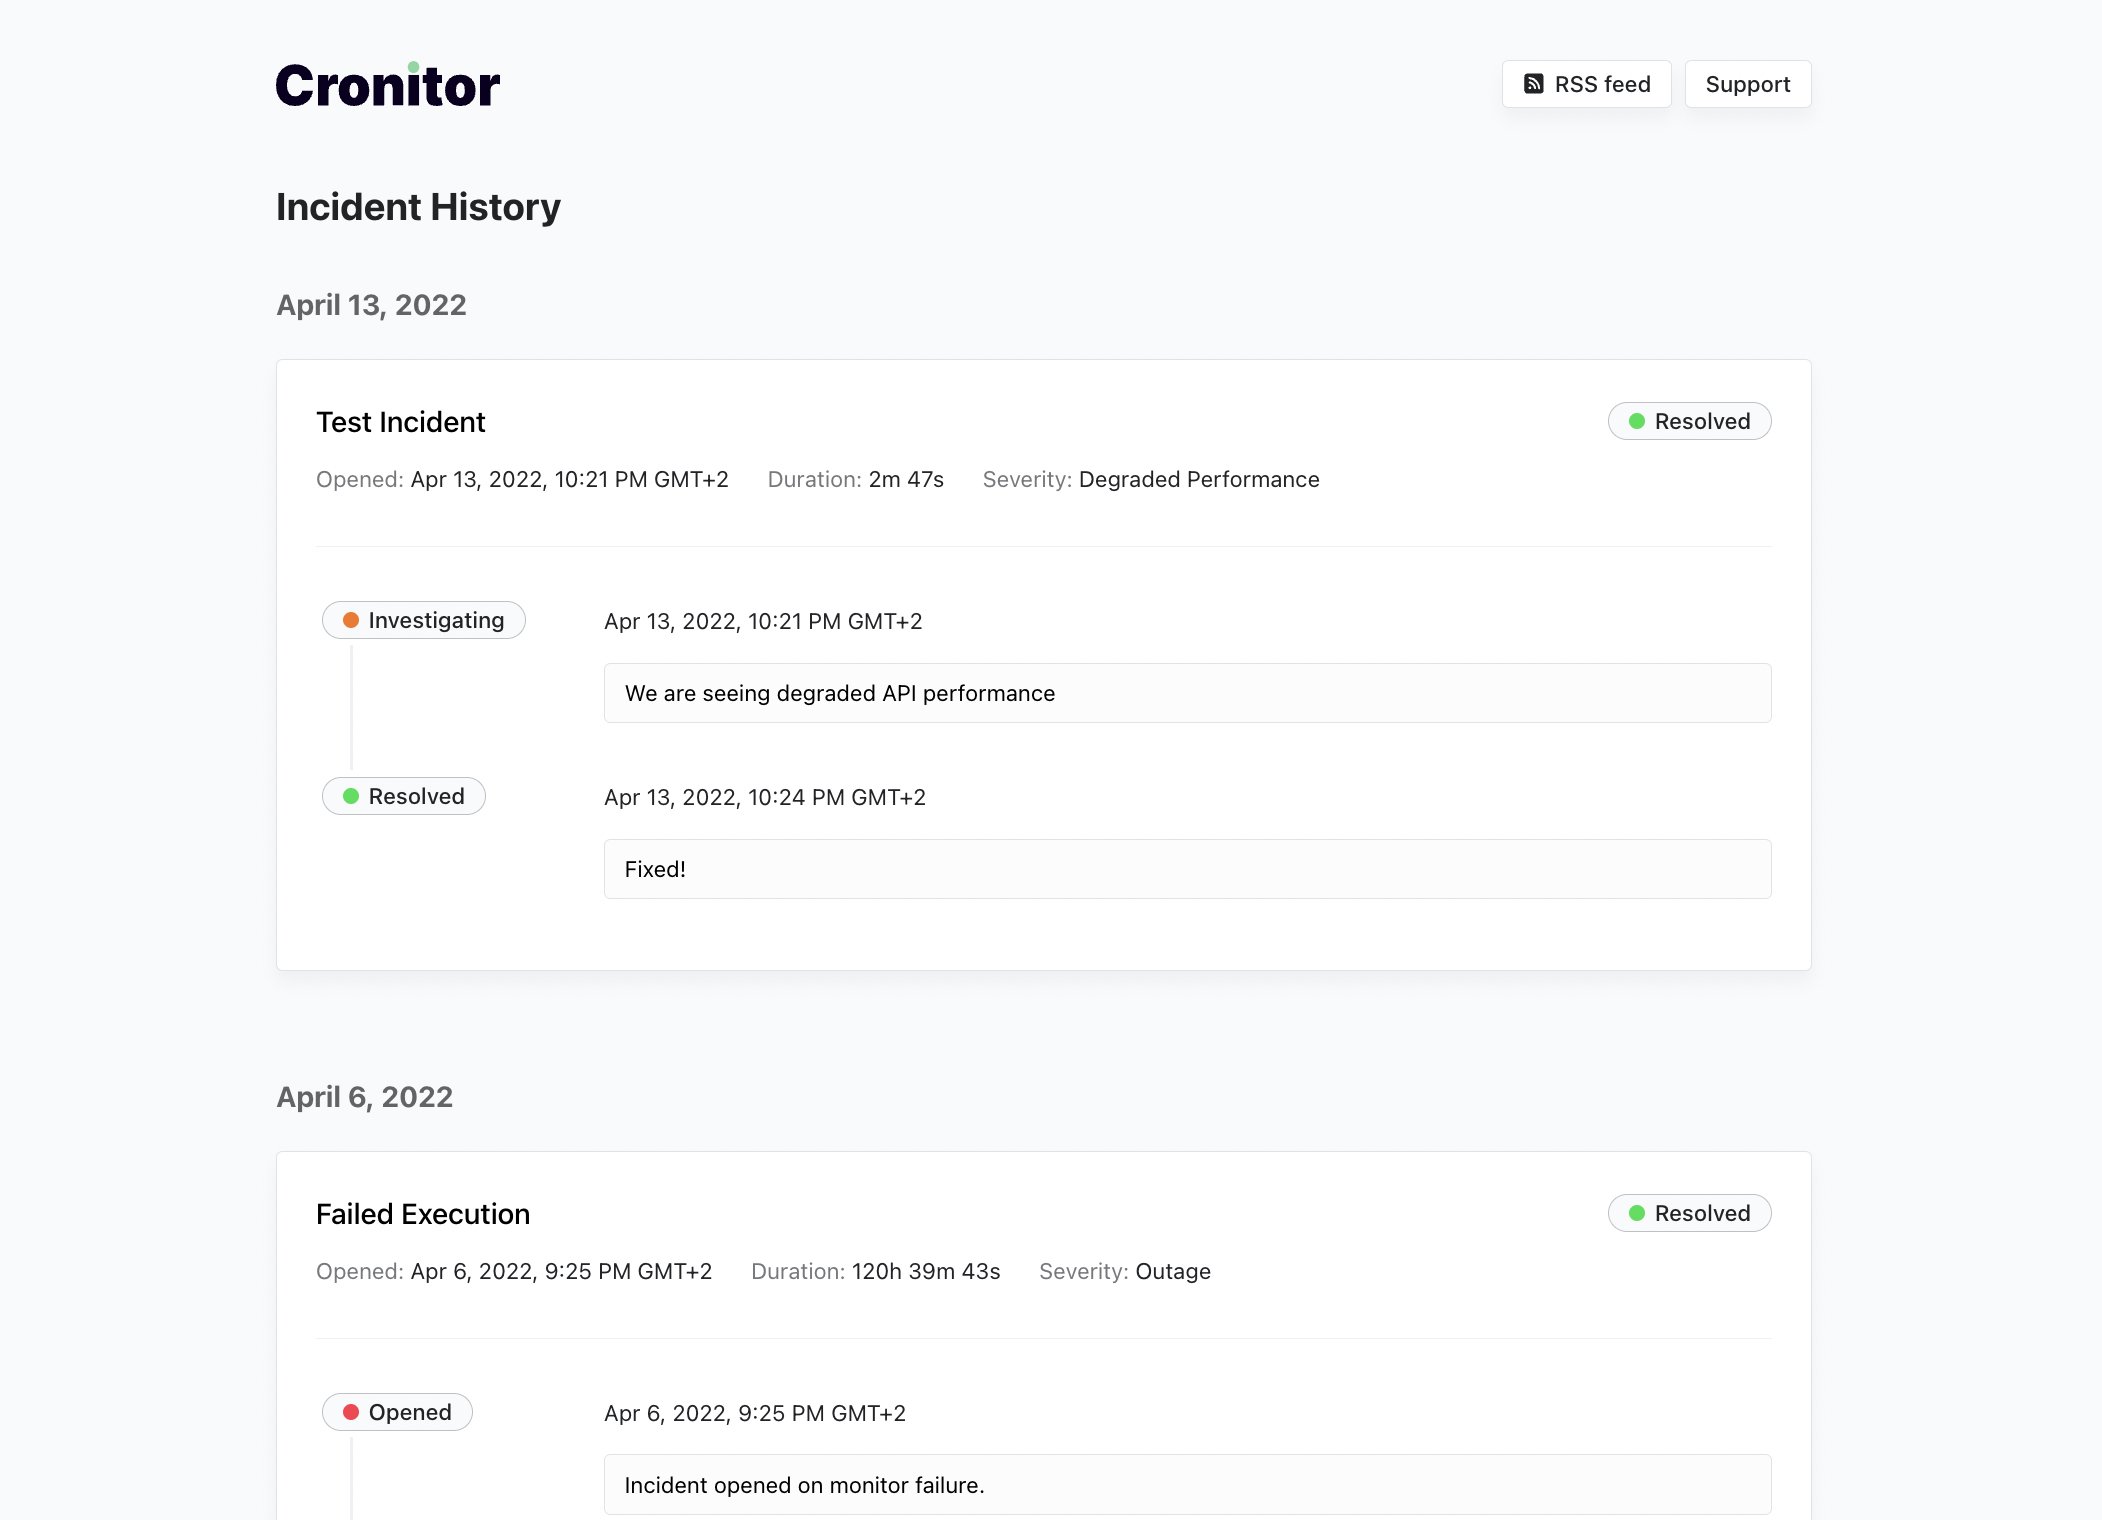
You can share individual incident URLs as they are permanent links. That means the URL does not change even if you resolve the incident or its details change. This makes it easier to collaborate both during and after the outage.
View historical uptime and performance
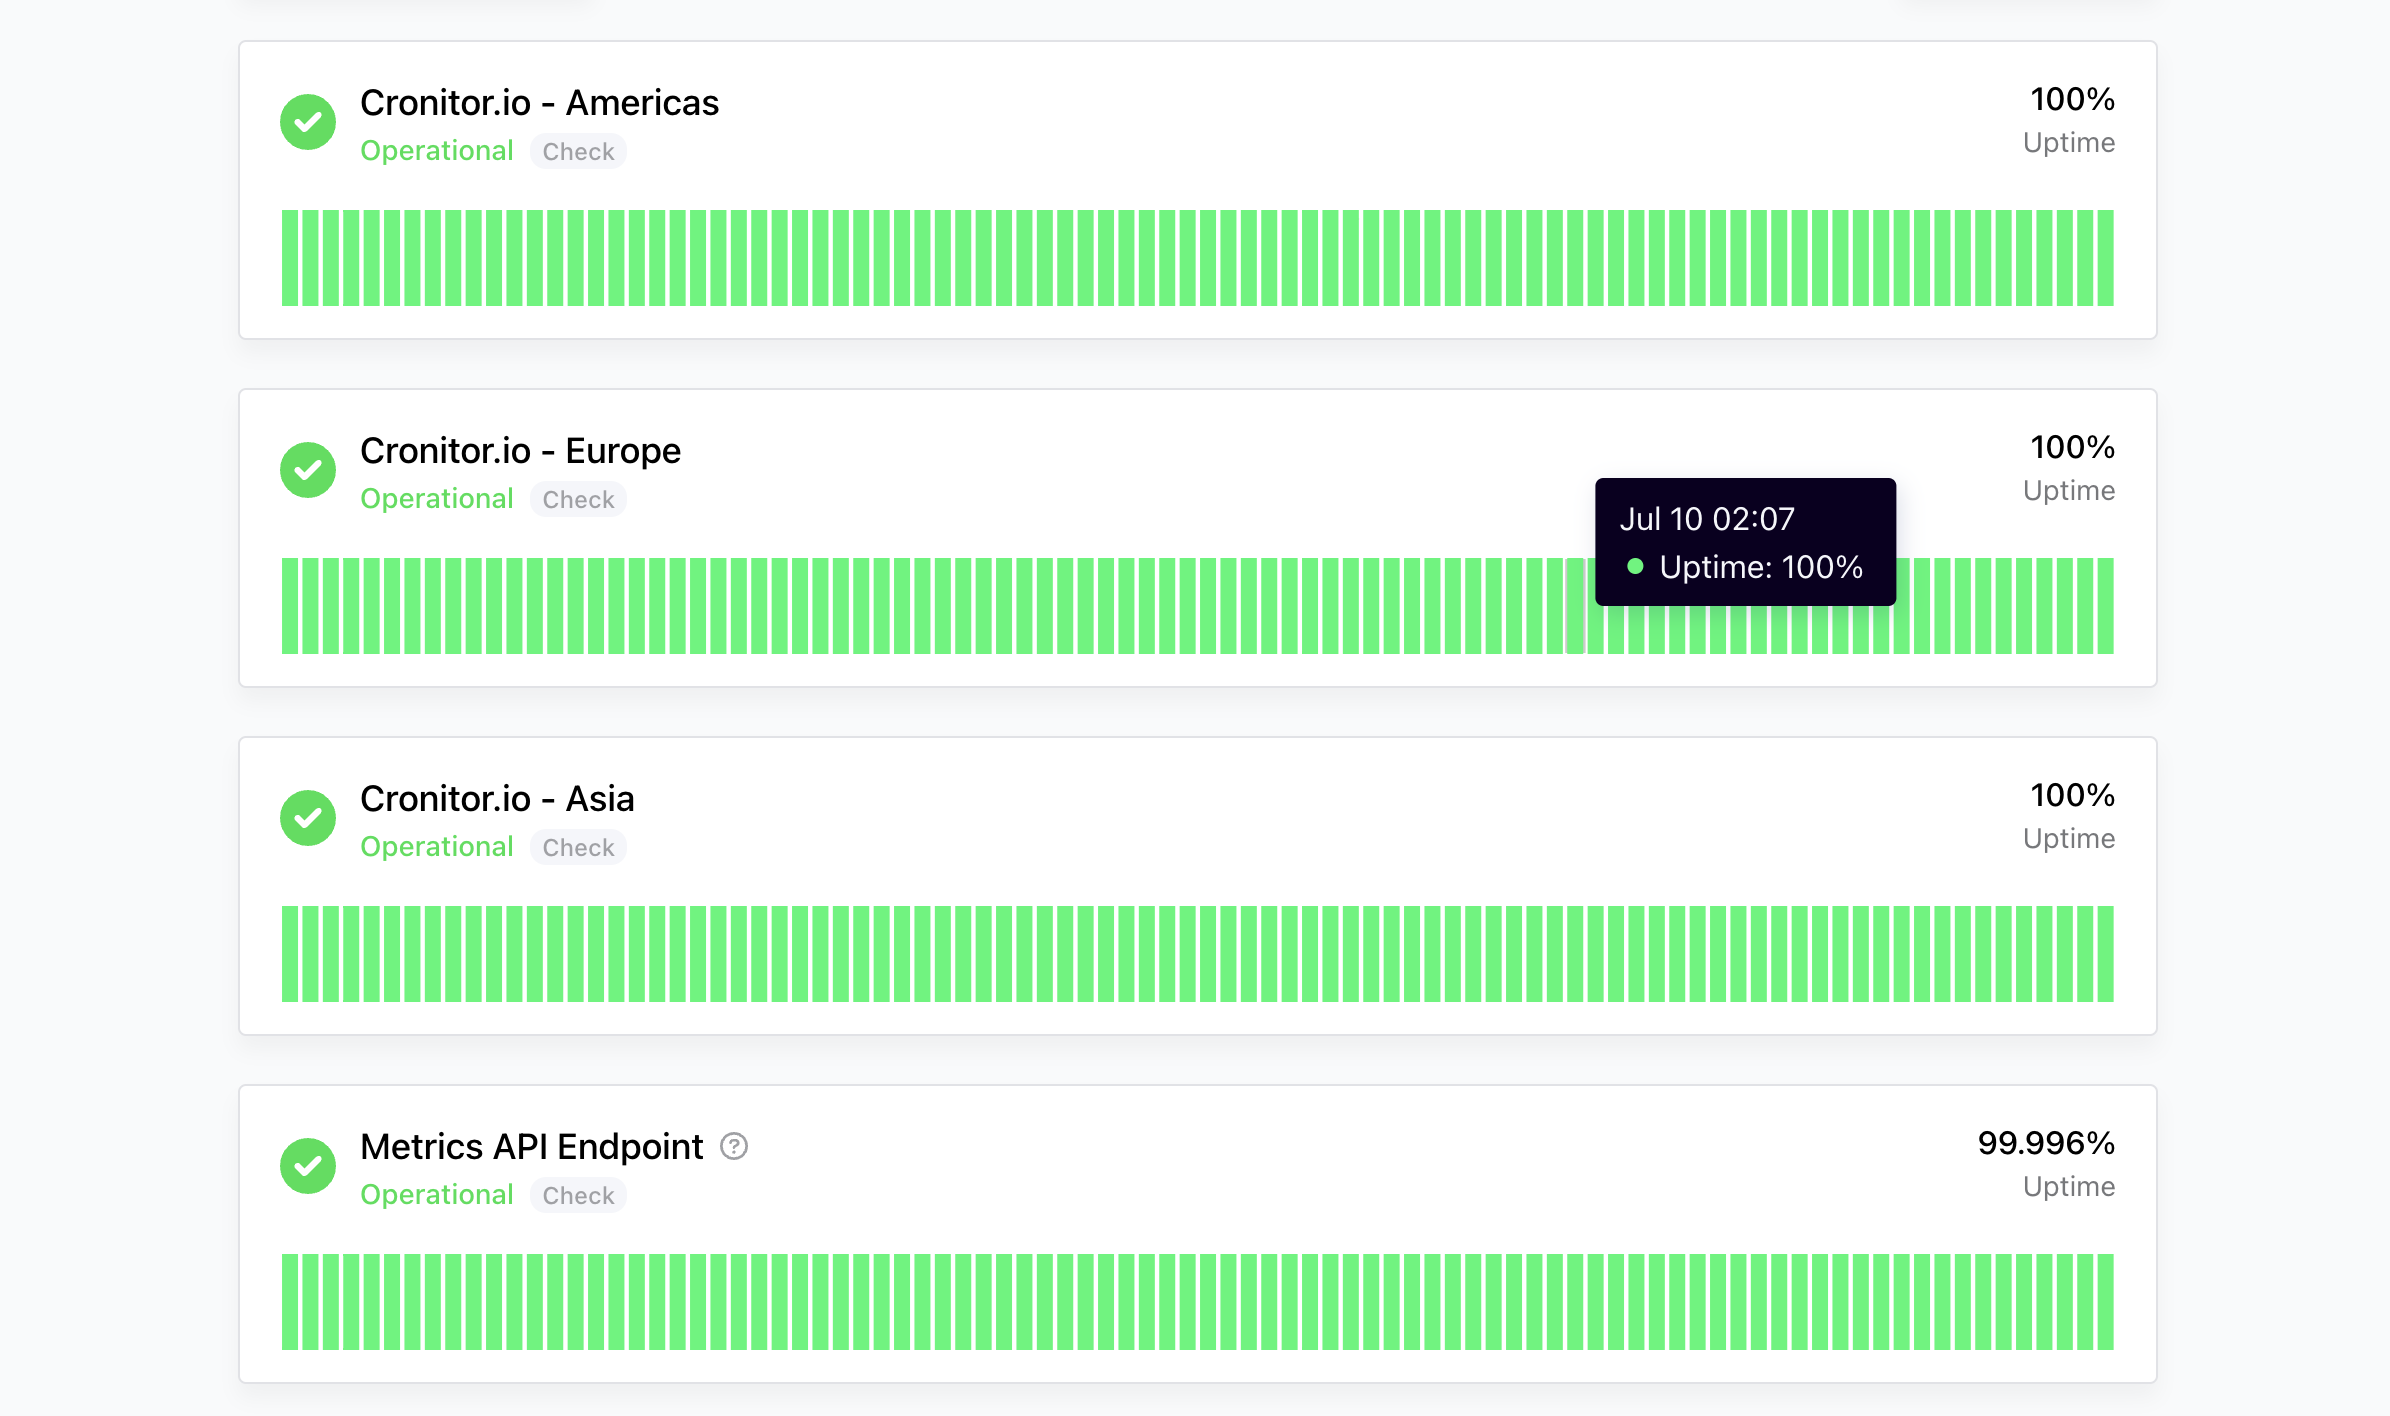
Every status page showcases your historical reliability with uptime and performance charts. They are automatically computed and kept up-to-date for you.
Providing historical uptime charts is a great way for your users to understand how reliable your service is. For example, this is what the uptime chart looks like.
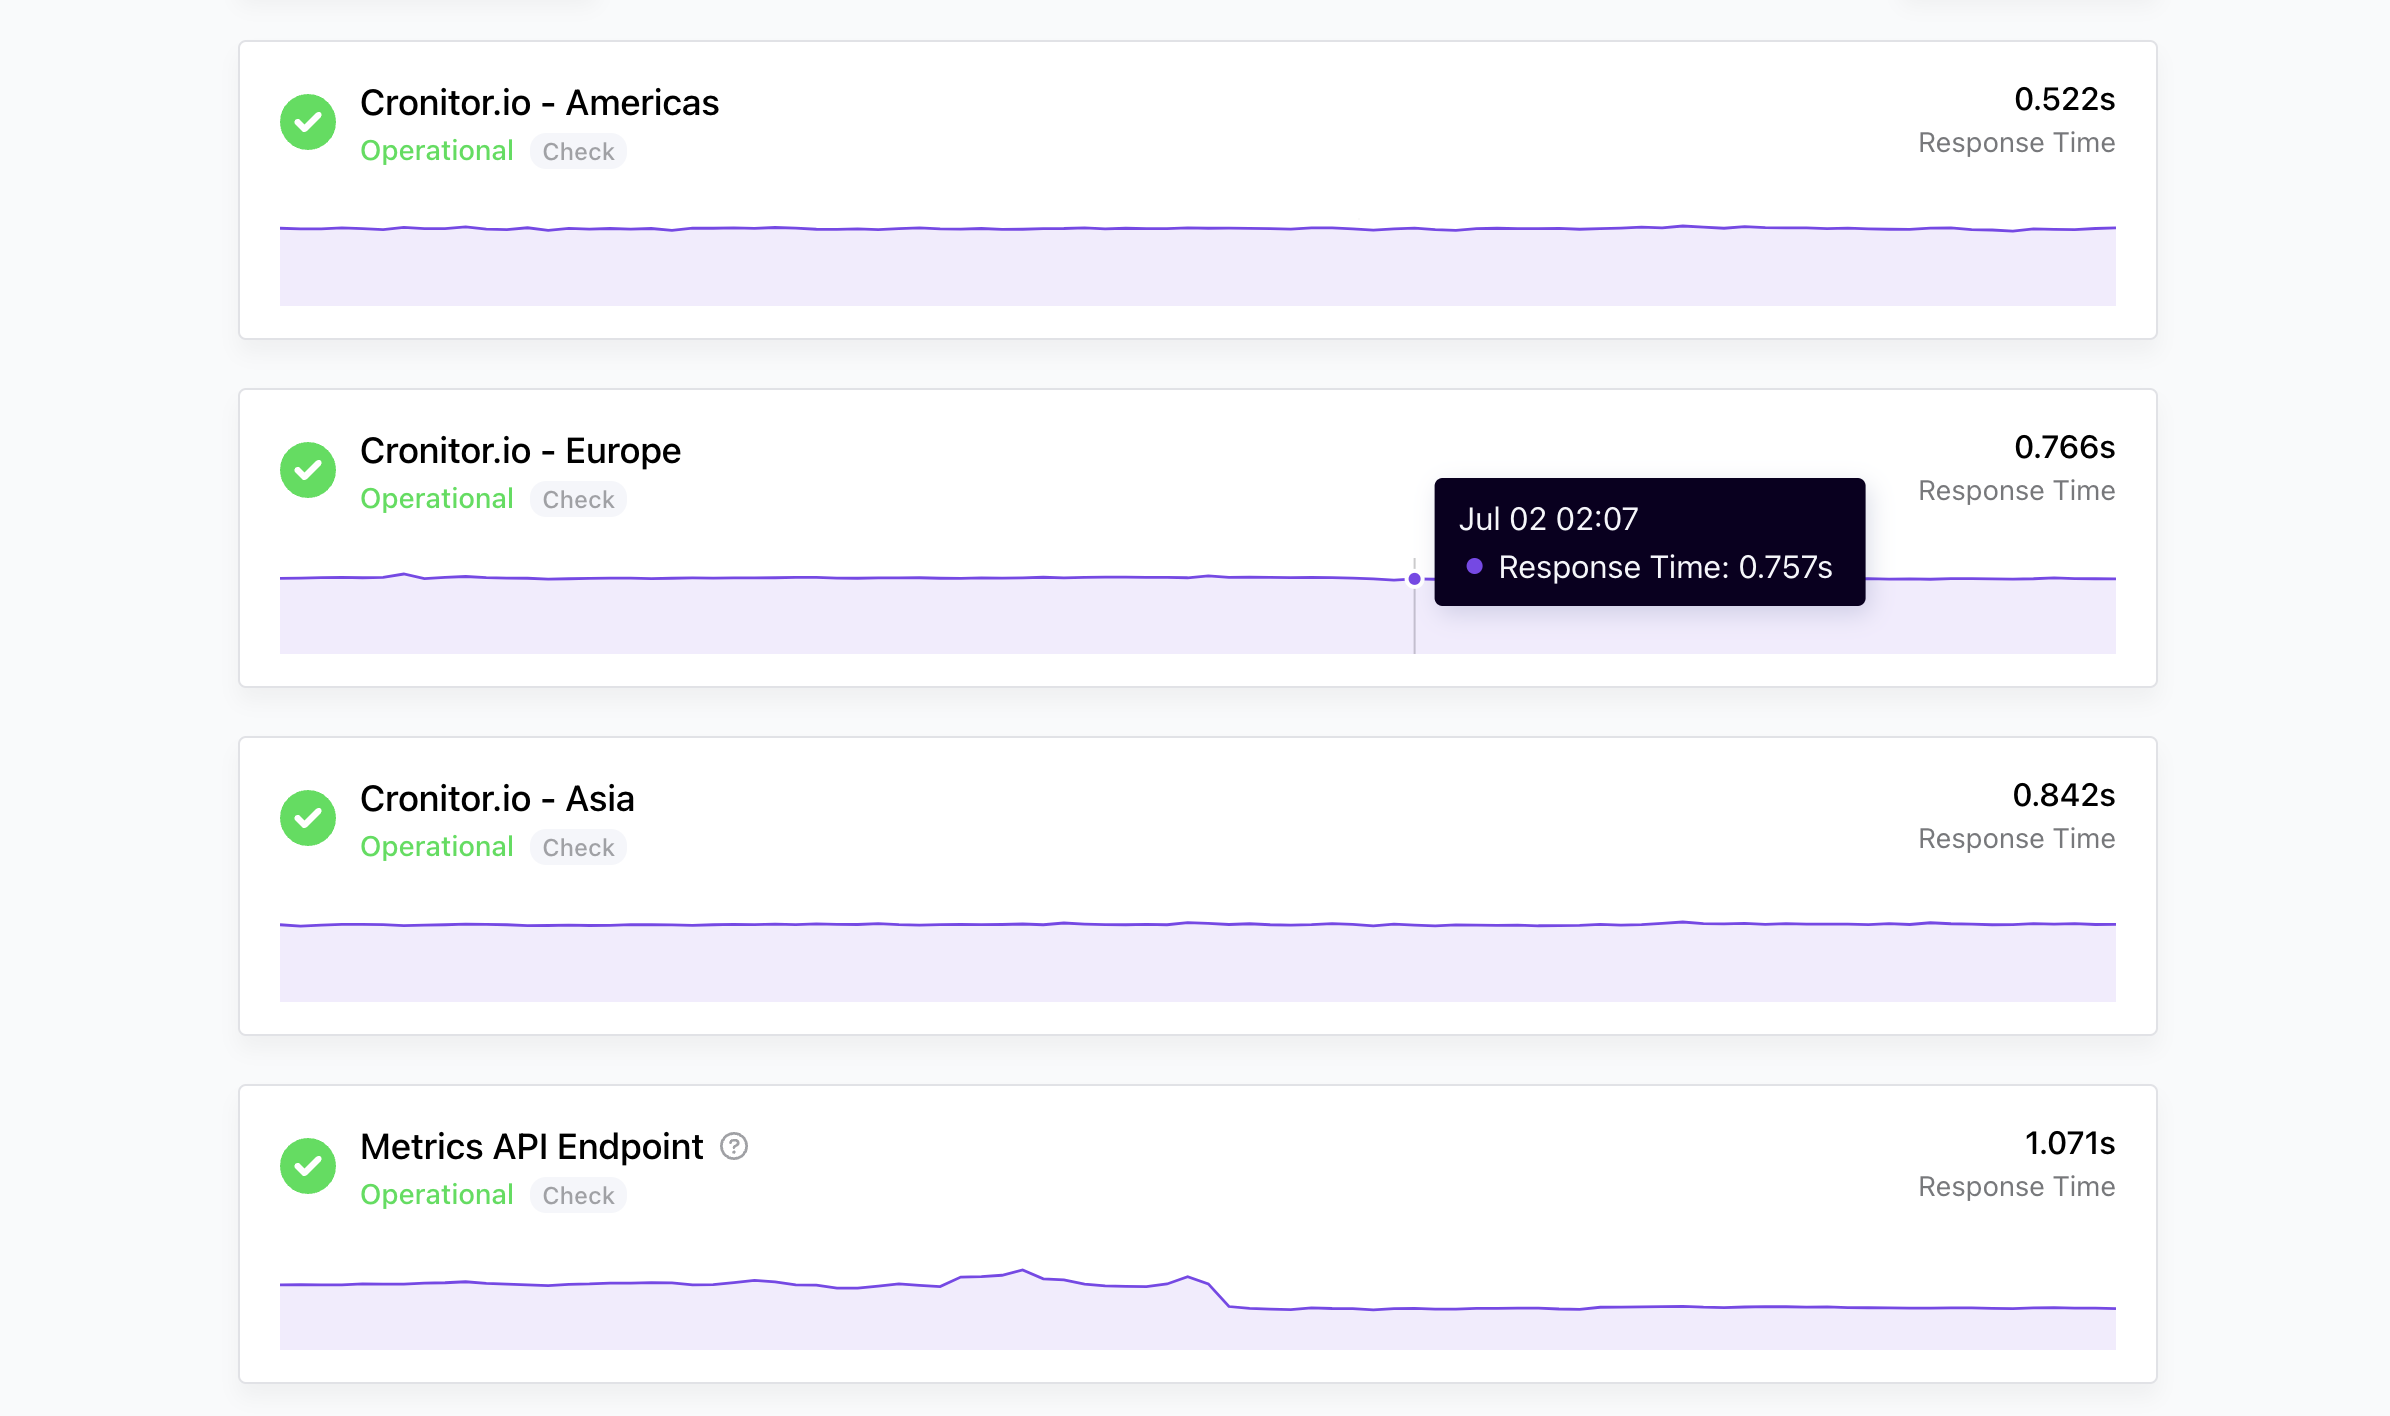
Performance charts are great to showcase your team SLAs and the typical performance of your APIs or cron jobs. This helps you set expectations with any users wanting to make use of your APIs. They can better understand what constraints or guarantees they're working with.
Here's an example of what performance charts look like.
Right now only monitors of type Check and Job support these charts. Group components and heartbeats will display a simpler status without charts instead.
Add your company branding
The status page is fully functional. However, it's lacking some company branding to make it clear to our users that they've found the official page.
We should add a company logo, some helpful links, and host the page under our own company domain.
Let's start by adding a company logo.
First, in the Cronitor dashboard, go to your status page settings. Then under “Brand logo” you can upload the logo you wish to display on the page.
![]()
Hit Save and reload your status page. It now showcases our company logo - it looks great!
![]()
Serve from your own domain
Every status page comes with a cronitorstatus.com subdomain of your choice. The free subdomain makes it easy to quickly preview the page.
However, most companies prefer to serve the status page from their own domain, eg. status.panelbear.com. This makes it easier for your customers to find your status page and know it's the official one.
Cronitor makes it super easy to use your own domain. It comes down to two steps:
- Set your custom domain in the status page settings.
- Configure your DNS records to point to cname.cronitorstatus.com.
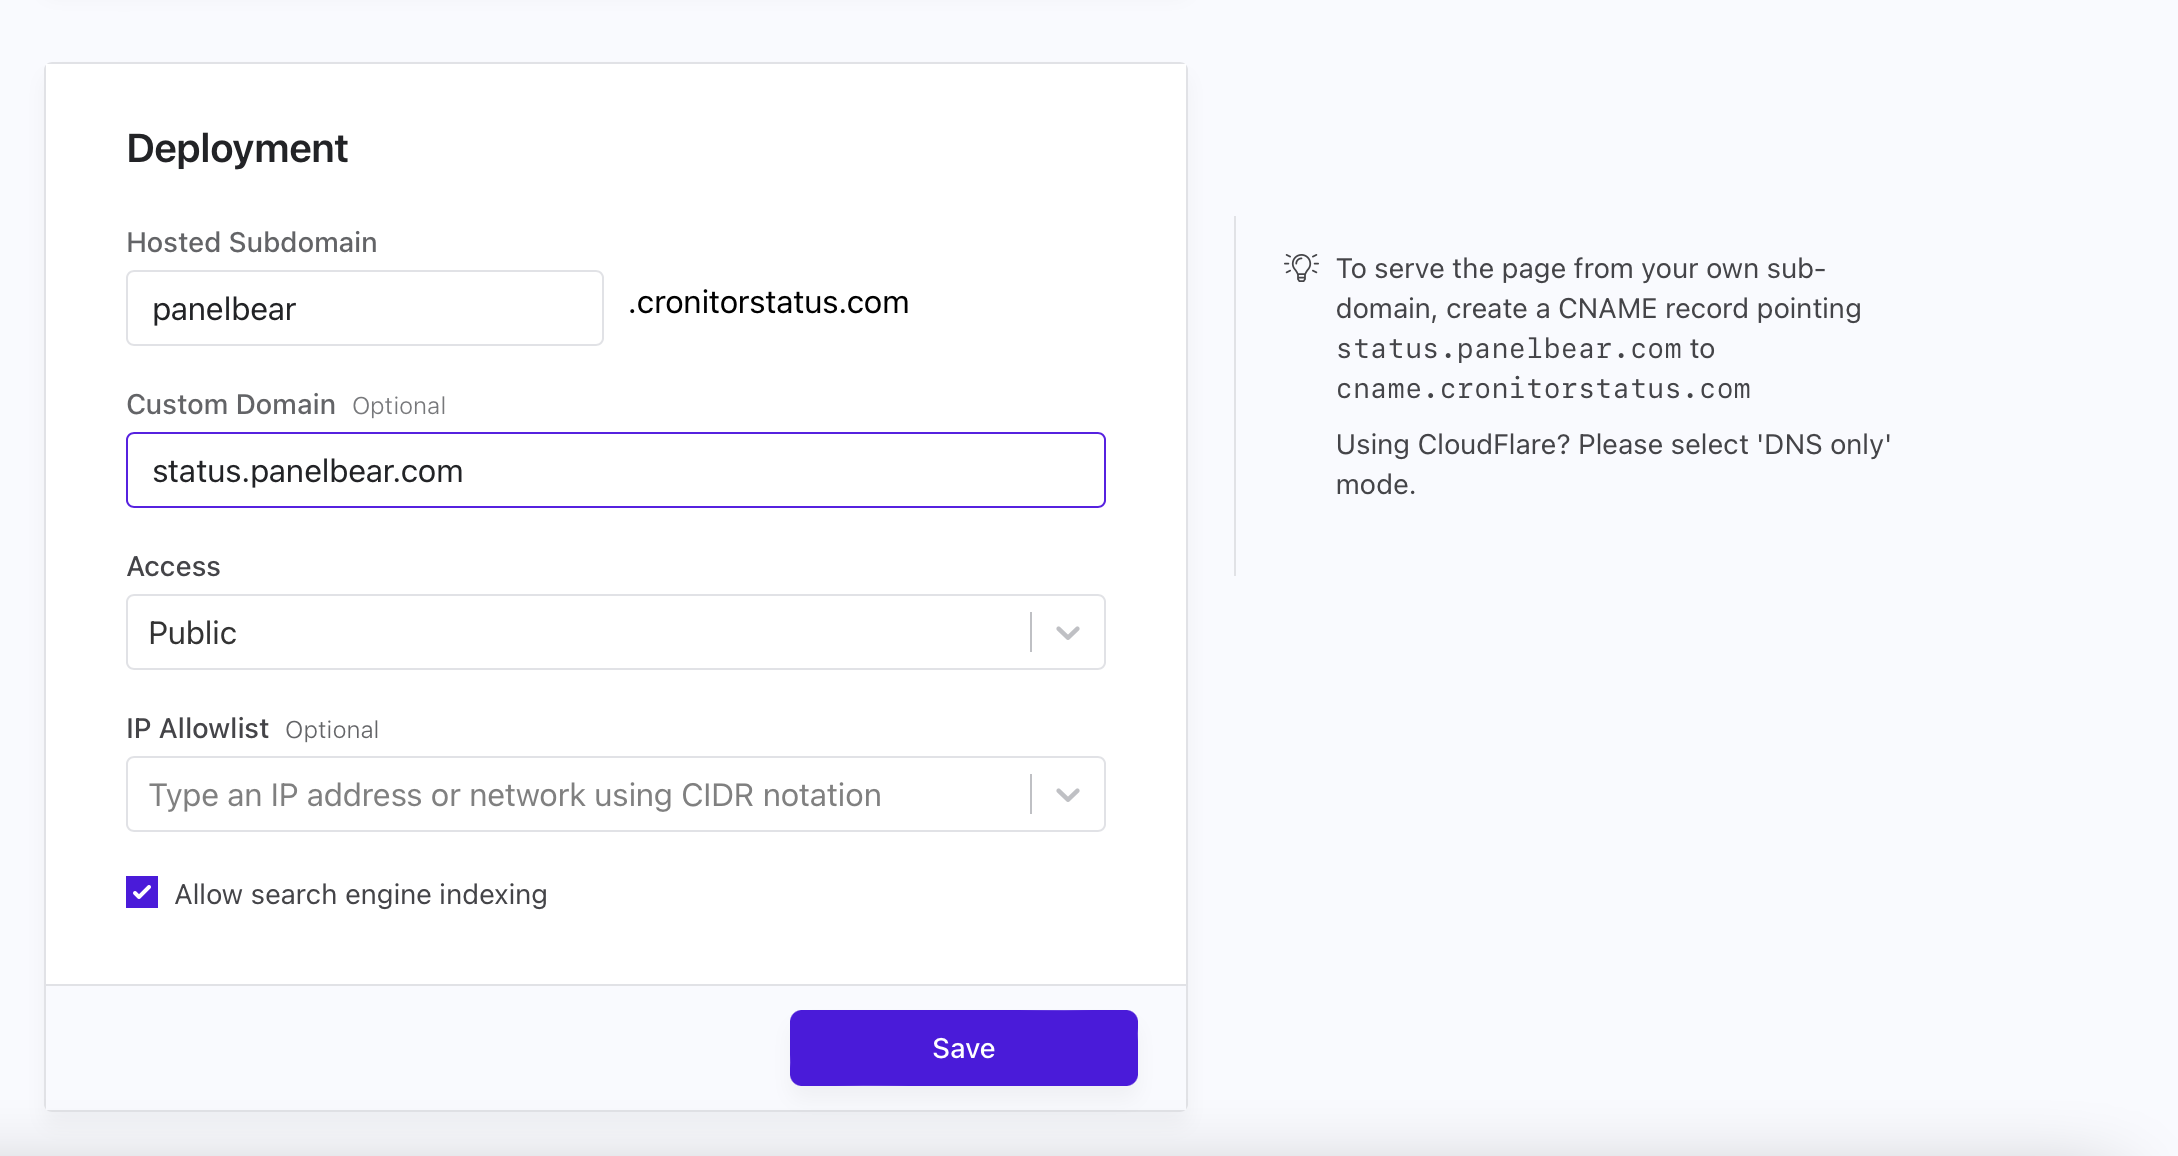
Let's add a custom domain for our example page.
First, in the Cronitor dashboard go to your page settings and input the desired domain. It must be unique across all status pages in Cronitor. We'll go with status.panelbear.com.
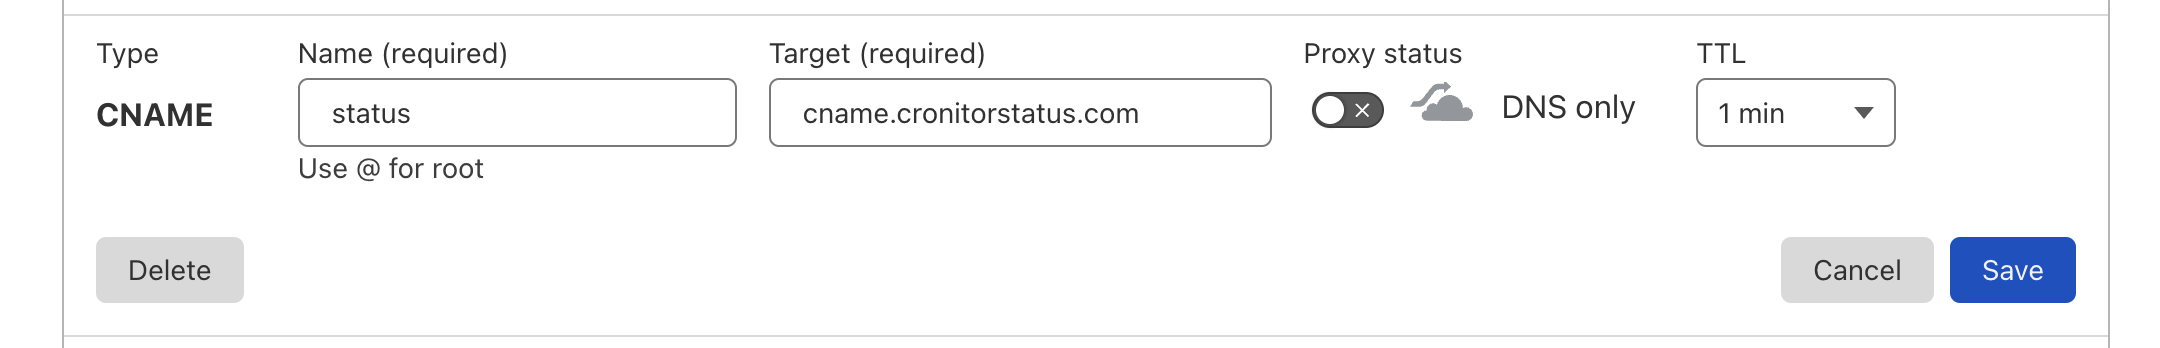
Hit Save, and now go to your domain DNS records. These instructions depend on which third-party provider you're using. We'll use CloudFlare as it's a popular one.
Add a CNAME record for status.panelbear.com with a value of cname.cronitorstatus.com. Important note for CloudFlare: be sure to select “DNS-only” mode or the custom domain might not work.
You should now be able to view the status page via the custom domain at status.panelbear.com.
When configuring DNS records it can take some time for our changes to propagate around the world. If you see any errors such as "DNS_PROBE_FINISHED_NXDOMAIN", it might be that the records haven't propagated yet. This process can take anywhere from a few minutes to 24 hours.
In case you're having persistent issues remember support is always an email away - we're happy to help out!
Add customer support links
Next let's include a link to our customer support page. This way users know how to get in touch or find your docs when they need them the most.
To do this, in the Cronitor admin panel, open your status page and click on Edit. Next fill-in a support URL and click on Save.
Open your status page and notice the new “Support” button on the top right corner.
Password protect your internal status pages
It's important to have control over who can access our status page. Most status pages are public, anyone who opens the page can see the components and incidents.
However, many companies also use status pages for internal teams. These pages are not meant for external users as they can contain sensitive data. That's why Cronitor status pages support password protection and IP/network based protection.
Let's enable password protection to see this feature in action.
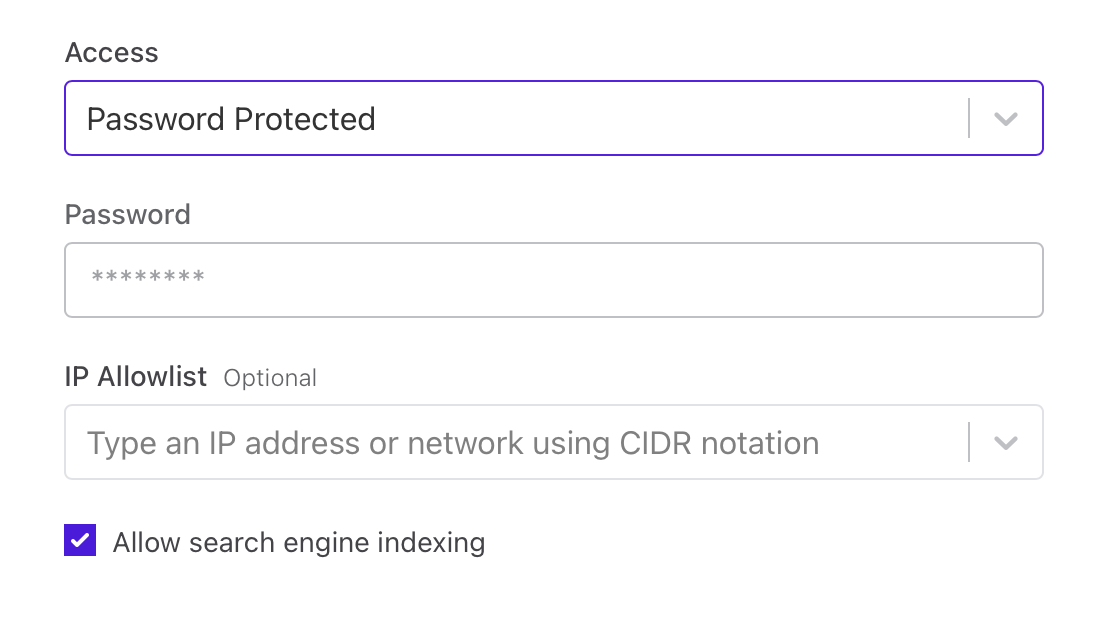
First, in your Cronitor dashboard go to Status Pages, find your page and click on Edit. Under Deployment, click on Access, and select Password Protected. A new field should appear where you can input your desired password.
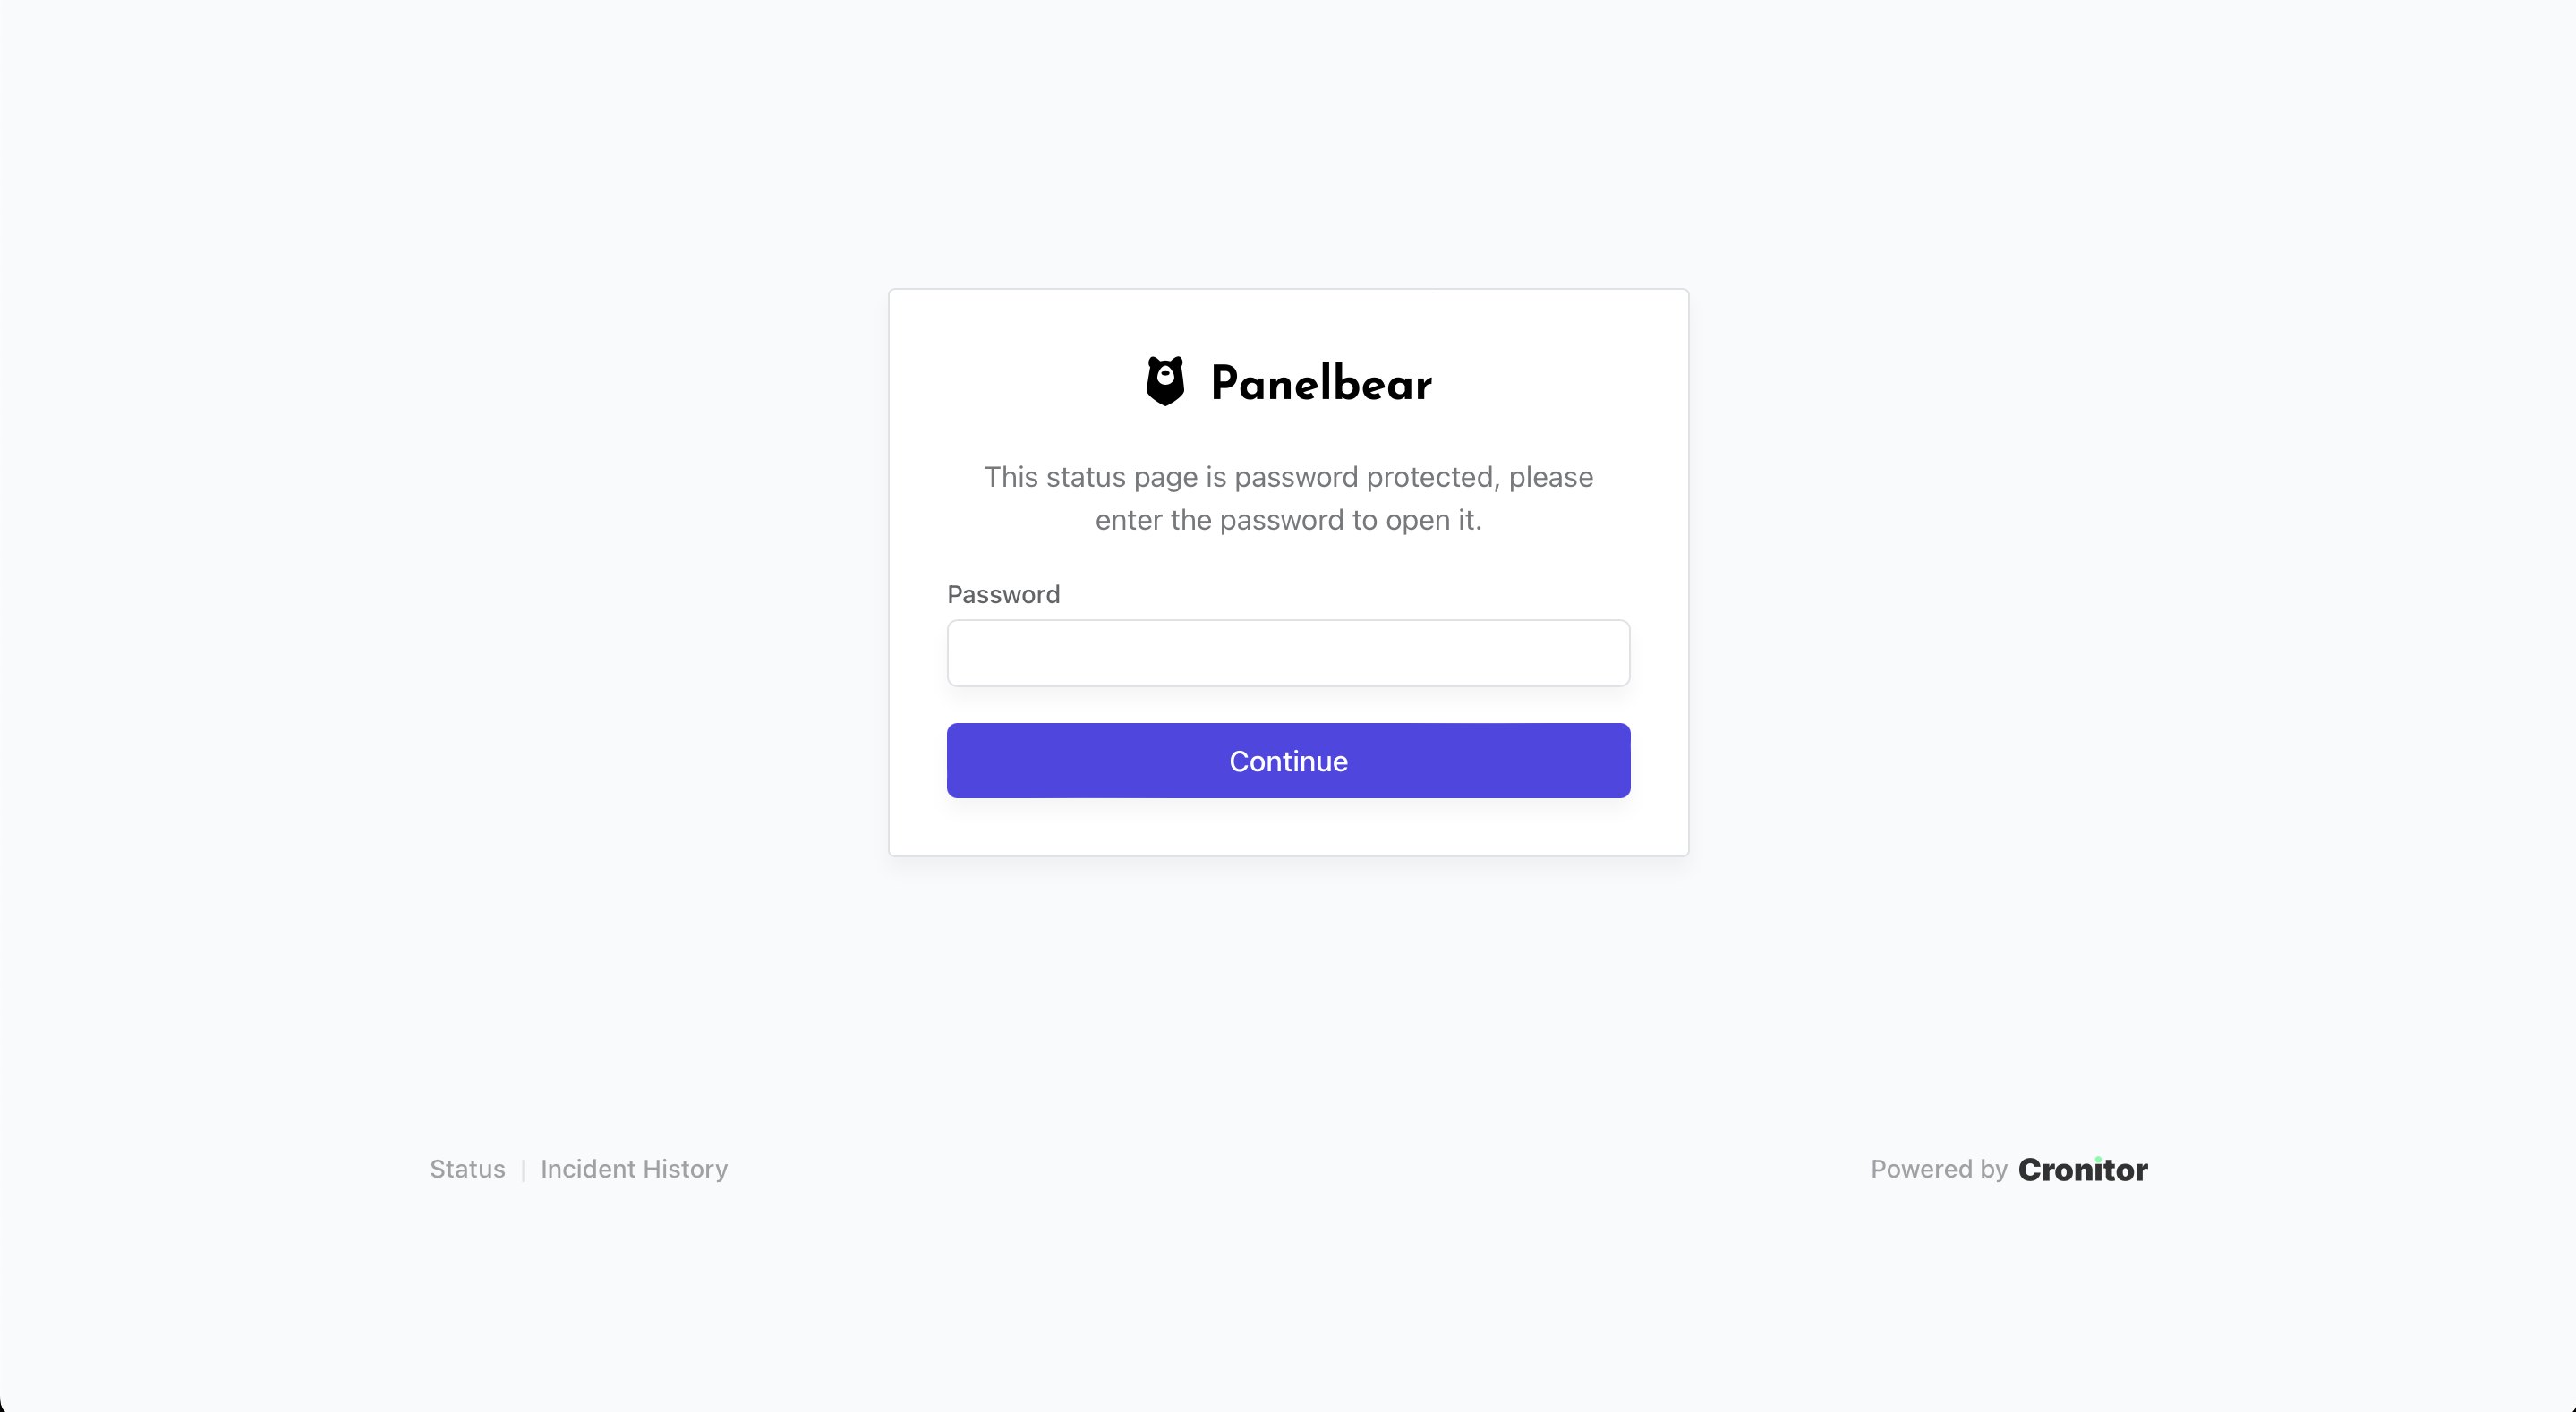
Save your changes. If you open your status page you should see that a password is now required to access the page.
Control access with IP allowlists
Companies usually prefer to protect access to their status page by only allowing a set of specific IPs or office networks to access it.
This is convenient for larger teams, as you'd no longer need to share the page password with everyone who needs access to it.
It also increases security by completely removing the possibility of leaking the password (there is no password!). It also helps you ensure that people who no longer work at the company no longer have access to the page.
Here's how to limit who can access your page based on their IP or network:
First, in your Cronitor dashboard, go to your status page settings and under Deployment you'll see a field called IP Allowlist.
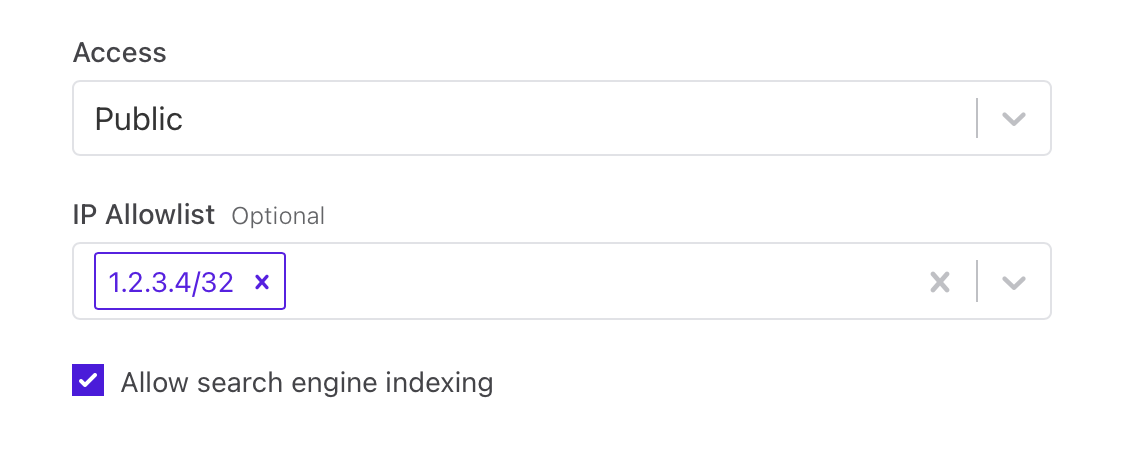
Here you can enter one or more IP addresses or CIDR networks. It supports both IPv4 and IPv6. Let's add our fictional office network to see it in action.
Only devices that match an IP or network listed in this allowlist should be able to view the page contents.
Try it out with your own IP. You should be able to view the status page - except it no longer requires a password!
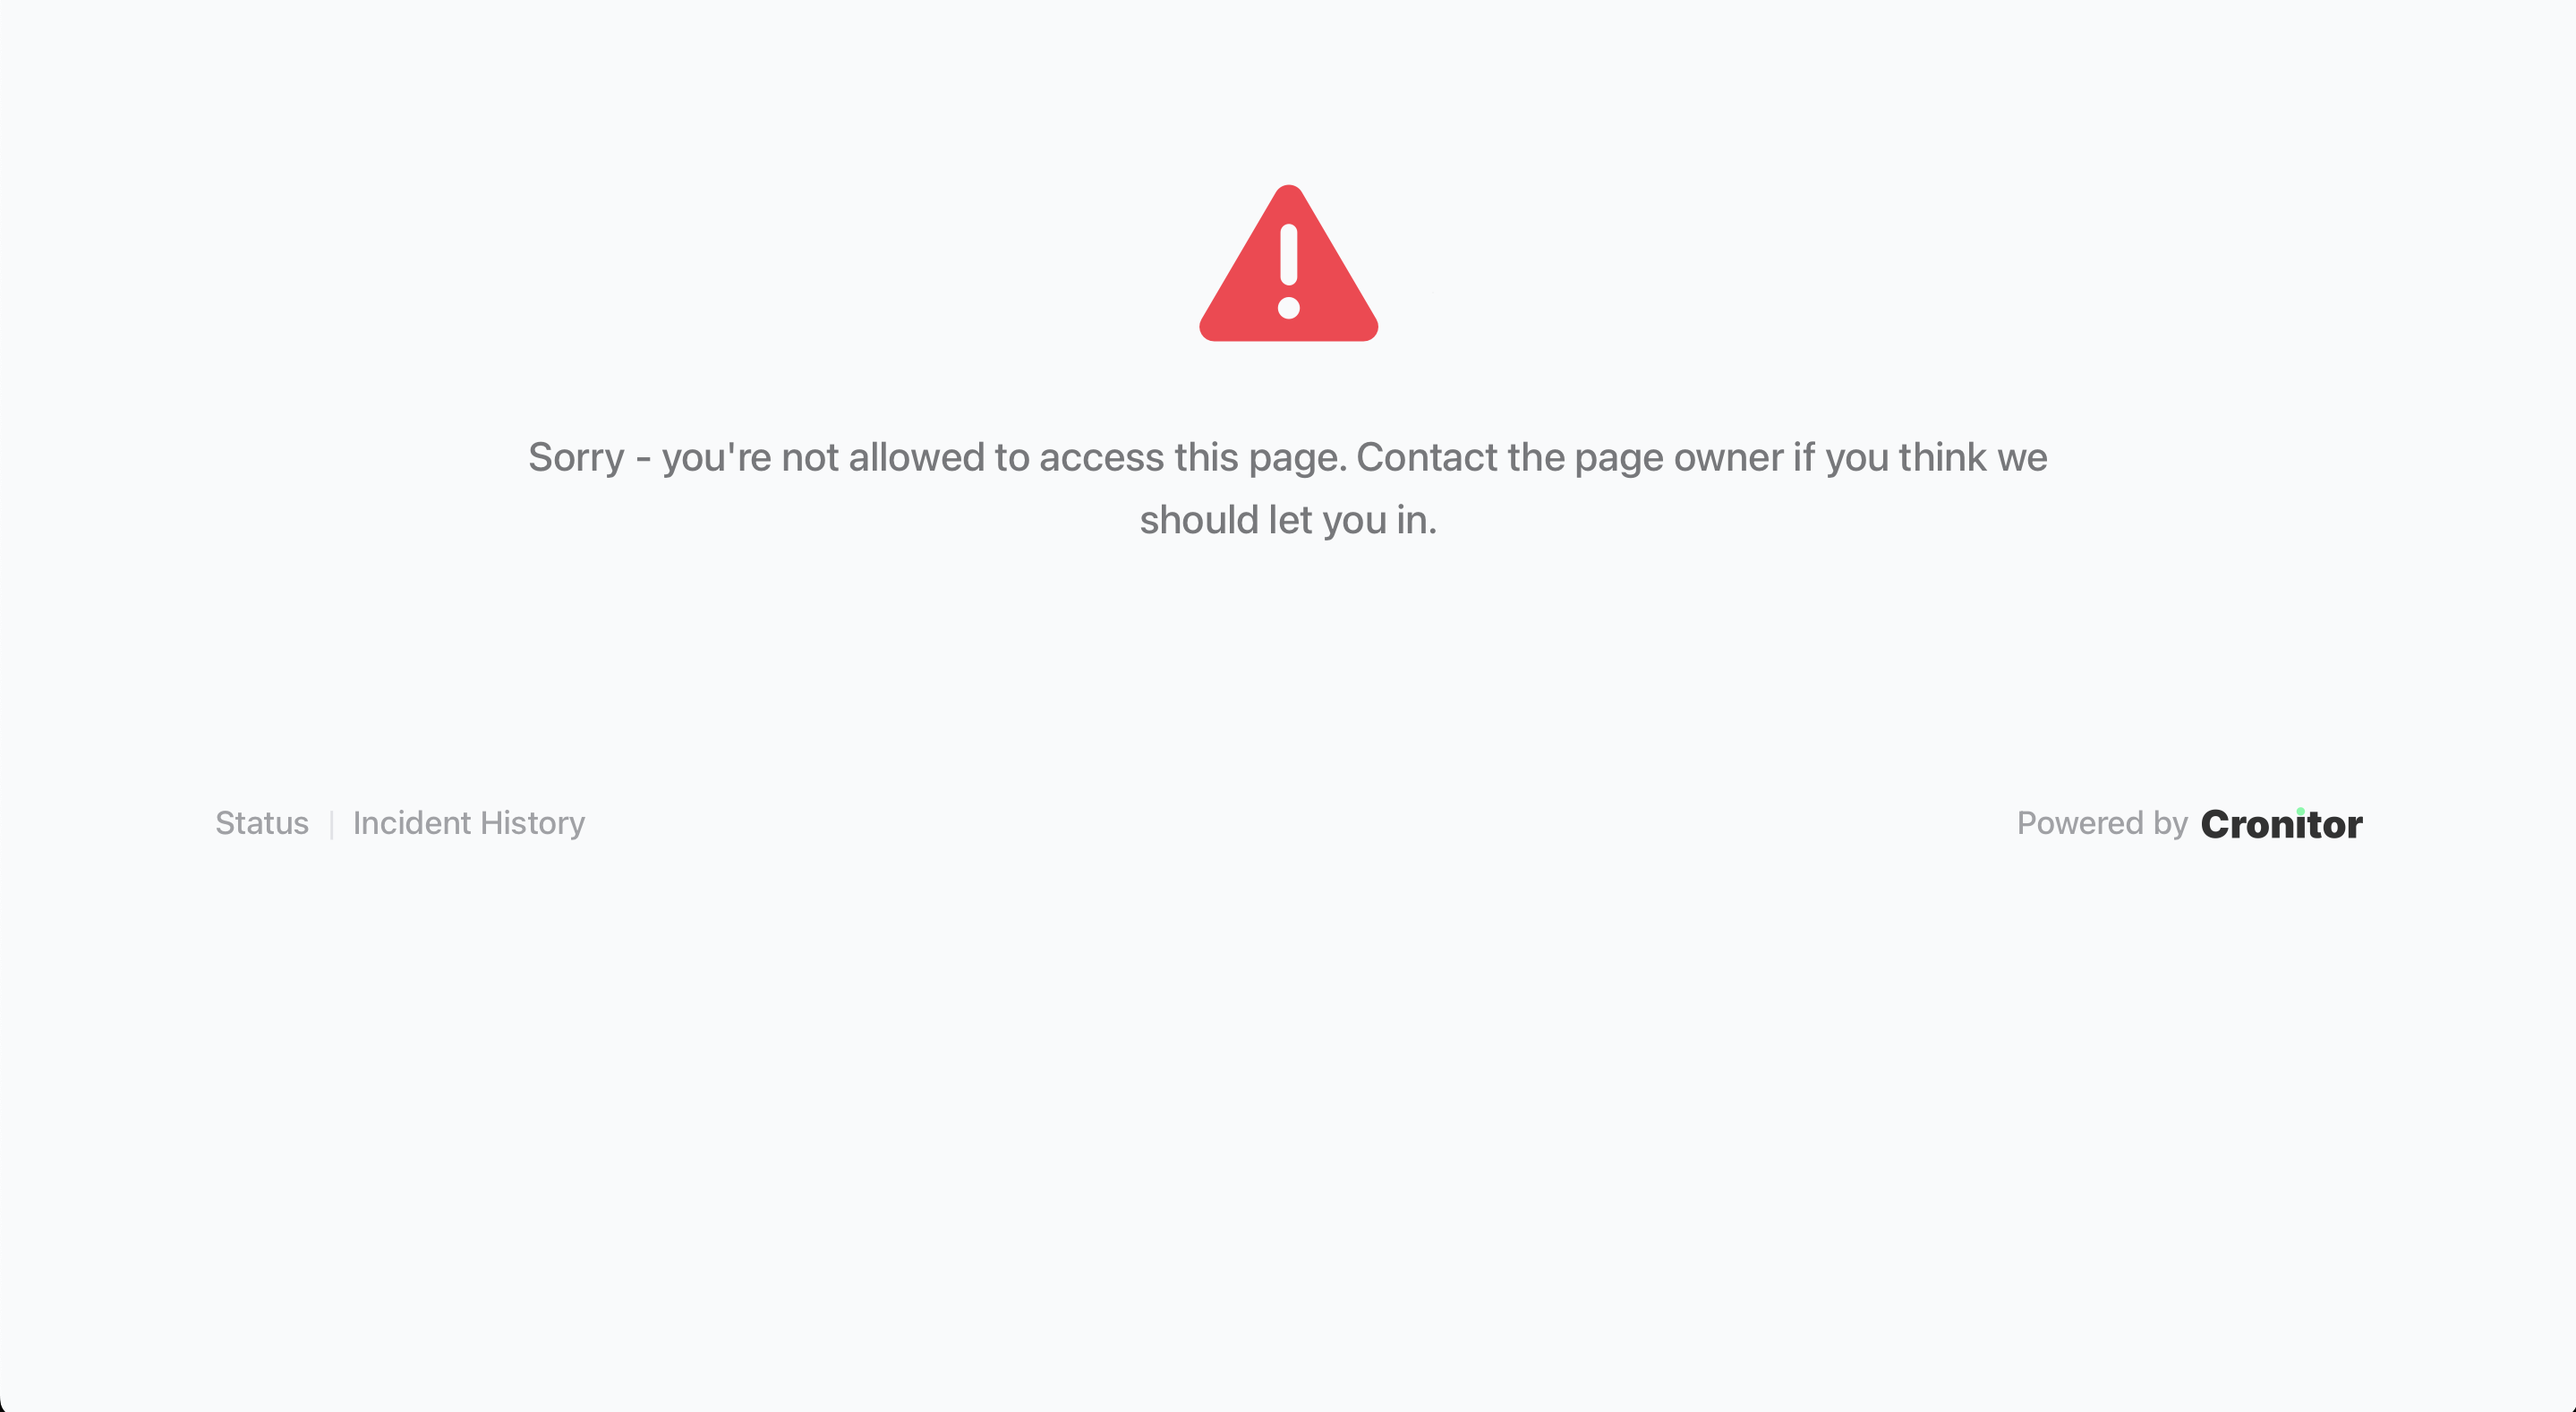
However, if the device IP is not granted access by the IP allowlist, the page won't disclose the content. That means components, metrics and incident details are not shown.
Add contextual info to your components
You can optionally add contextual information to each of your status page components.
This helps your users understand:
- Which URL is being monitored by an uptime check.
- What to do in case of a failing component.
- What SLAs they can expect out of your service.
- Any additional information you consider important.
To add component descriptions, in your Cronitor dashboard go to your status page and click on the edit button next to any component.
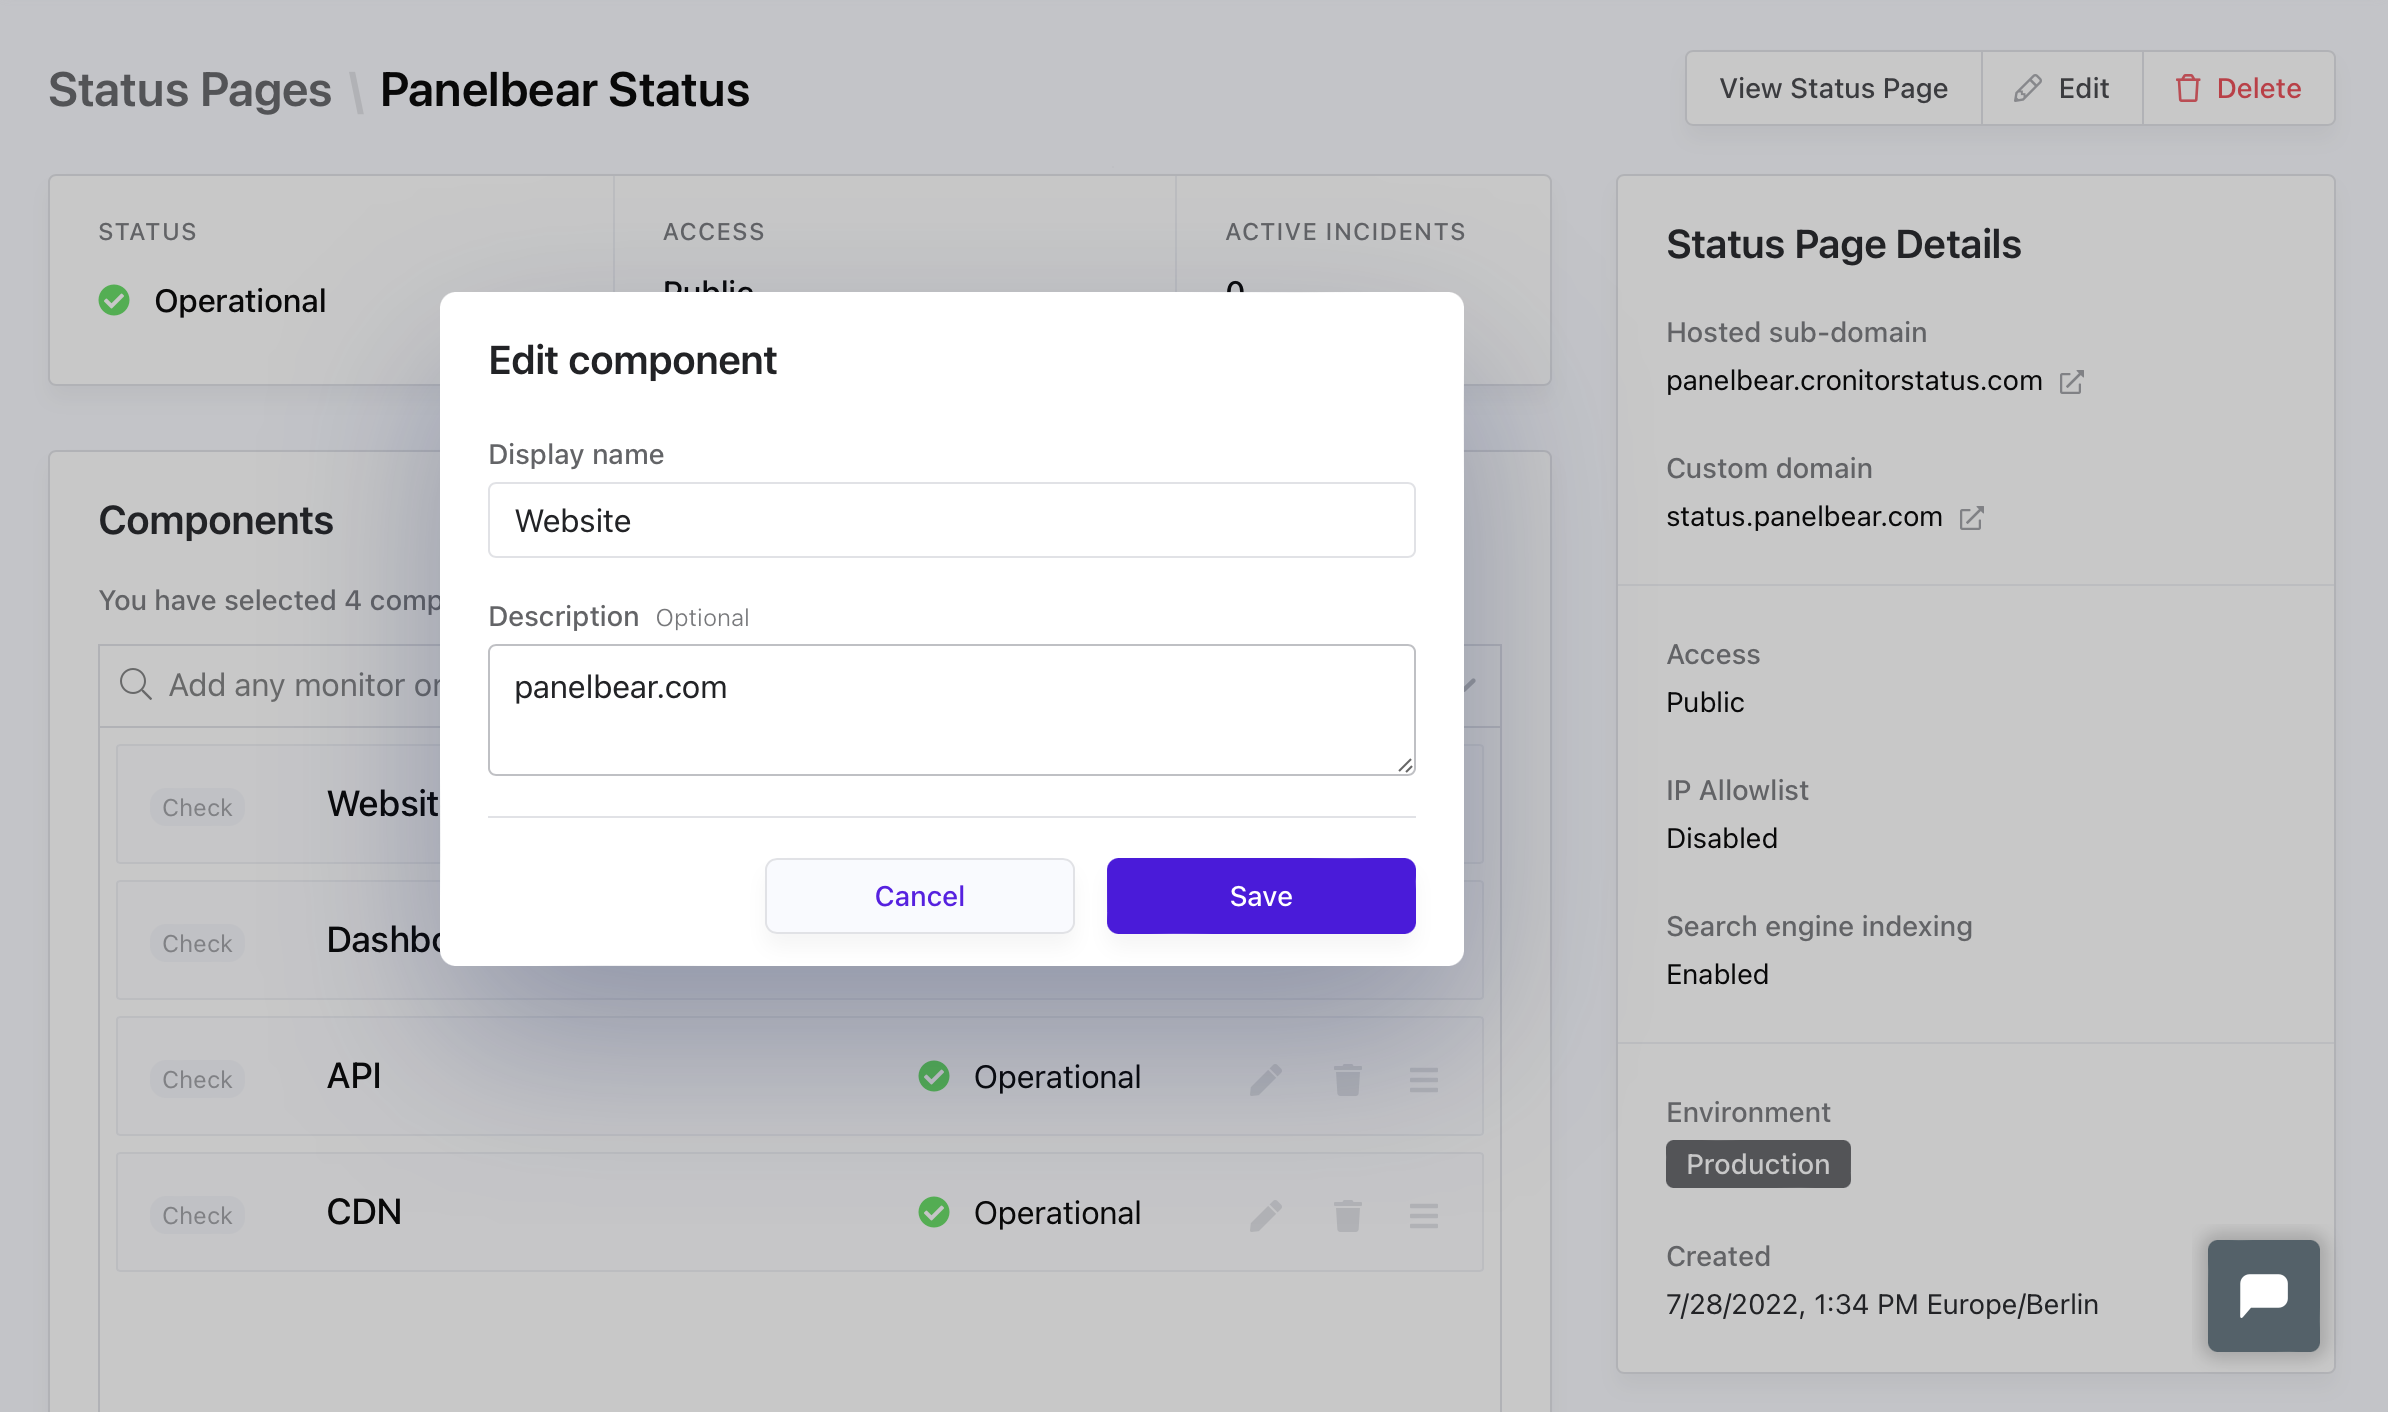
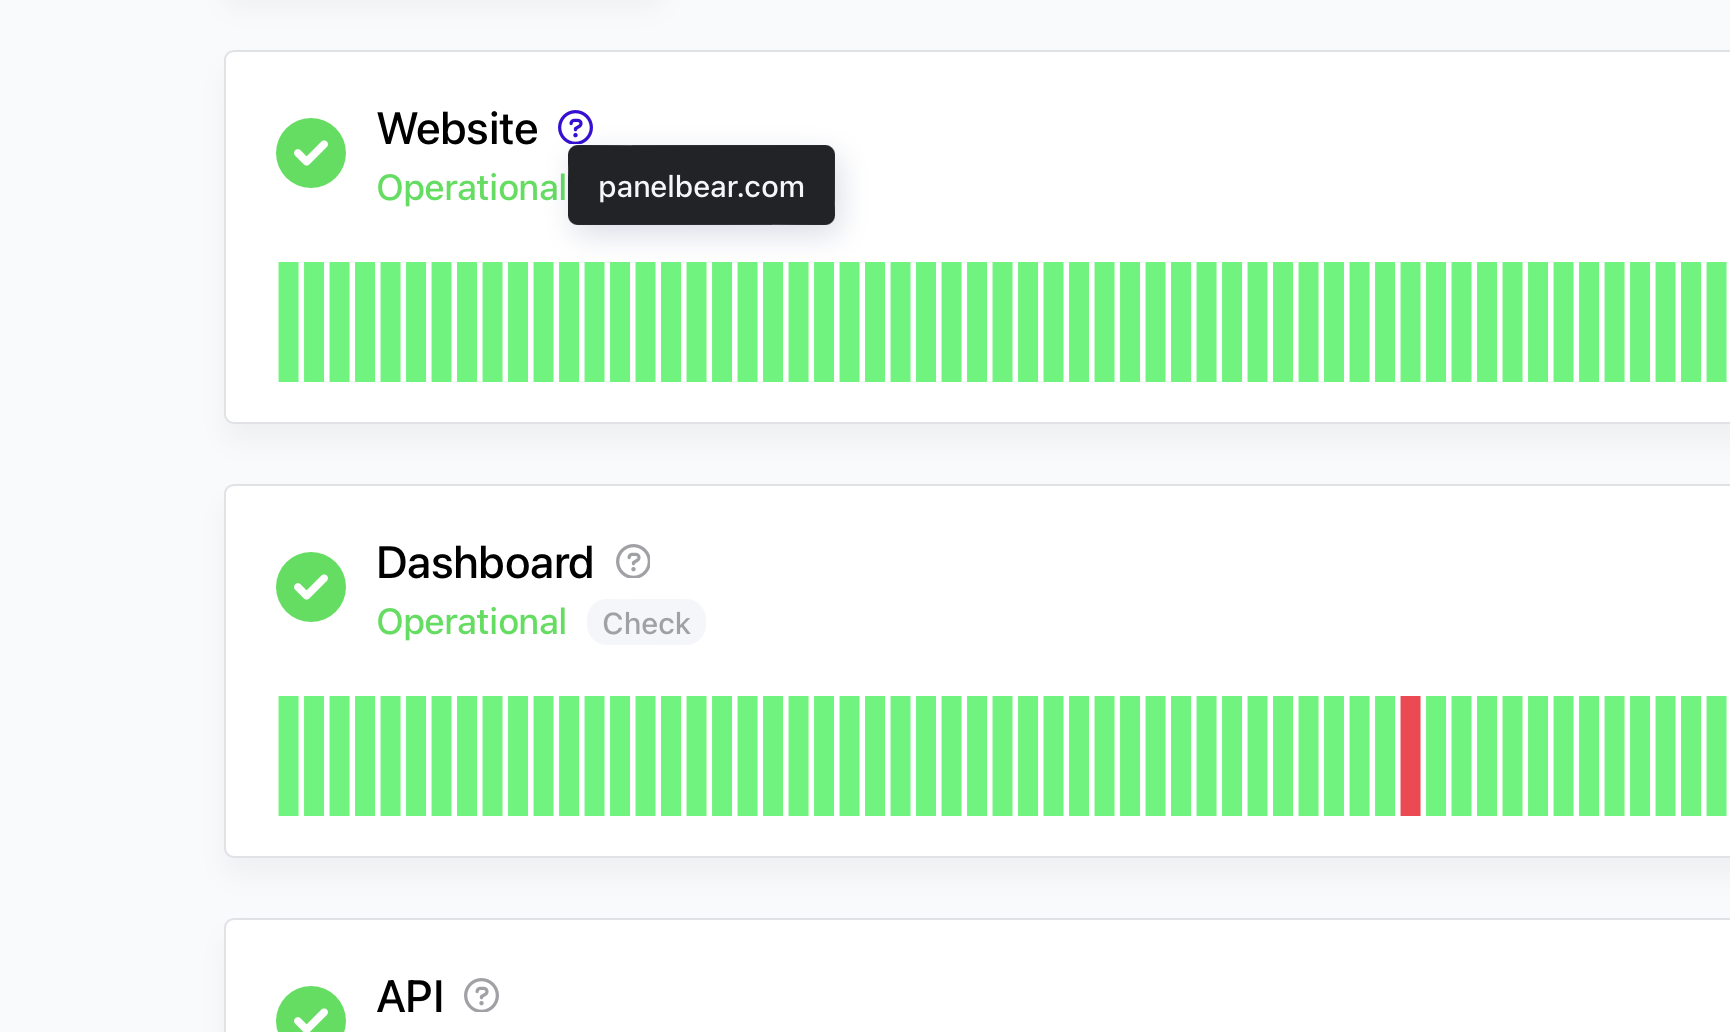
Add a component description and hit Save. For our example, we just want to clarify which endpoint is being monitored by this component. But you could add any other information you deem useful.
Once you've added a component description, head back to the status page and reload it. You should now be able to see the description by hovering over the info tooltip next to the component name.
Subscribe to RSS feeds
A really useful feature of status pages is for your customers to be able to subscribe to updates.
That way, your users can get notified whenever the status changes, instead of having to constantly refresh the page to see if there's any update.
Every status page comes with its own RSS feed out of the box. To access it, simply click on the RSS Feed button on the top right corner of your status page.
Being able to subscribe to updates is a really powerful feature. This also enables your internal teams to get notified in their platform of choice. For example via email, webhooks or even by subscribing a Slack channel for updates.
Try status pages for free
In this guide we explained what status pages are and how they benefit anyone running mission critical software.
We also covered how to create a status page using Cronitor. We then explored how to customize the page, publish and resolve incidents, and how to get the most out of it.
Cronitor is the simple, yet powerful monitoring platform. It's trusted by thousands of developers from around the world. Create your free account and launch a status page in minutes.