Incident Management
The Complete Guide to Status Pages
It's 2 a.m. and your phone is ringing with an on-call alert.
Production is down, and support tickets are coming in. Customers want to know what happened and when the site will be back.
Your team is busy fixing the issue. Someone still has to tell customers what's going on.
A status page is one URL where you publish those updates, and where customers can read them without filing a ticket. This guide creates one in Cronitor, then covers components, incidents, branding, a custom domain, and who can open the page.
The reference for the same product, including the API, is Status Pages. Copy for the updates themselves is in incident communication templates.
What is a status page
A status page shows the current health of your software. Anyone with access can see the latest status, an ongoing incident, and past incidents.
Incidents happen. The page is where customers read the current status and the history of past ones.
Customers use it to answer a few practical questions:
- Is the site up?
- How steady has it been lately?
- What response time or duration should I expect?
- Is there an incident open right now?
- Where do I go for help?
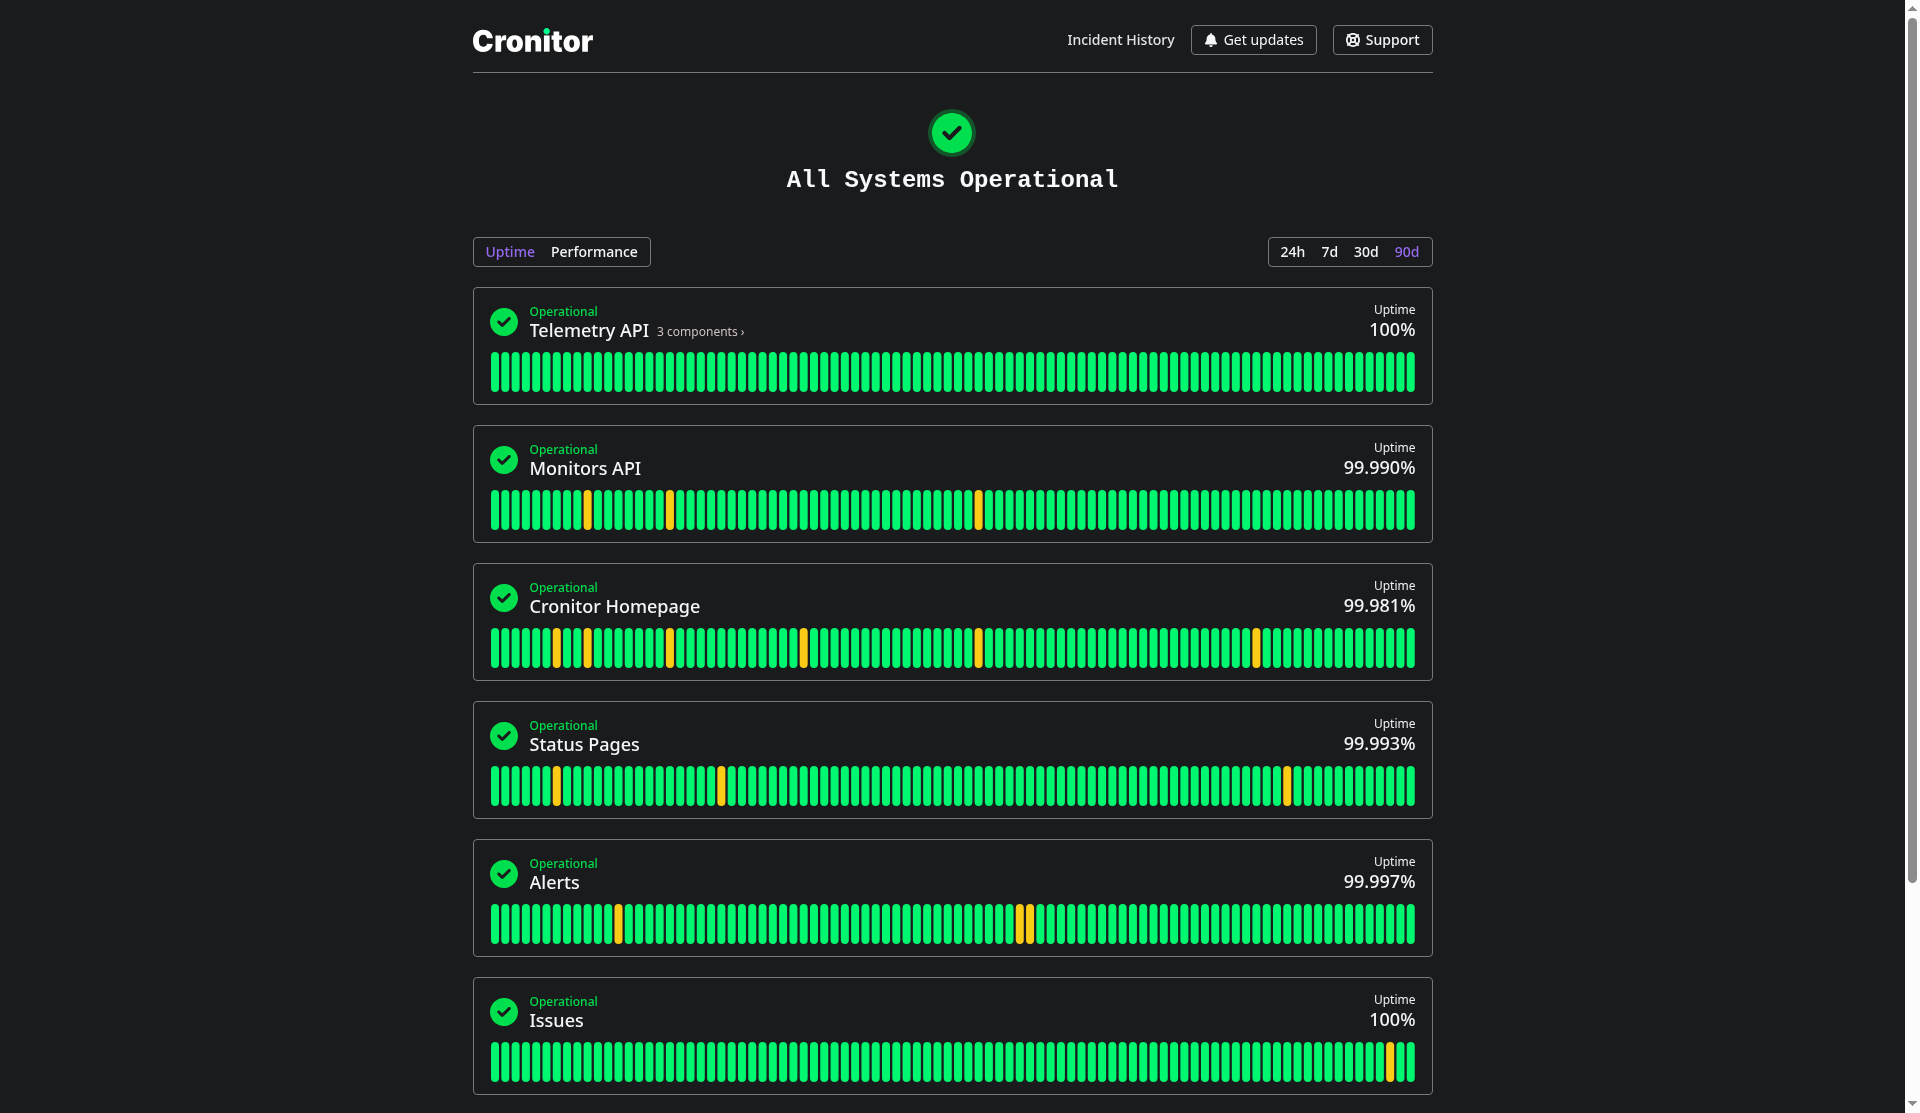
status.cronitor.io is a live example. The screenshots in this guide are that page and the admin screens behind it.
Why teams publish one
While the service is up, the page shows recent uptime and, when you leave performance on, response time or job duration. During an outage, it is the place you post updates, so the same text reaches customers, subscribers, and your own team.
What you can do from the page:
- Monitors can open and resolve an incident on the page when a component is set to publish automatically.
- Subscribers can follow the page by email, RSS, Slack, or webhook instead of refreshing it.
- A public history gives prospects something concrete to read about past outages.
Create a status page
Cronitor's free Hacker plan includes 5 monitors, 1 dashboard user, and 1 basic status page with 50 subscribers. A logo or custom domain is the branded add-on, $25 per month per page on the Business plan. Password protection and an IP allowlist are the private add-on, $50 per month per page. Those prices are from the pricing page on October 9, 2026.
In the dashboard, open Status Pages in the left menu. The menu items are Home, Jobs, Checks, Beats, Sites, Status Pages, Issues, Logs, Timeline, Maintenance, Get Started, Settings, Docs, and Help.
A brand-new account with no pages does not show Create Page. Instead it shows a short form with a status page name, a subdomain, Create Status Page, and Full Configuration. Create Status Page saves from those two fields. Full Configuration opens the full form described below. Create Page, in the screenshot, is the button once the account already has a page.
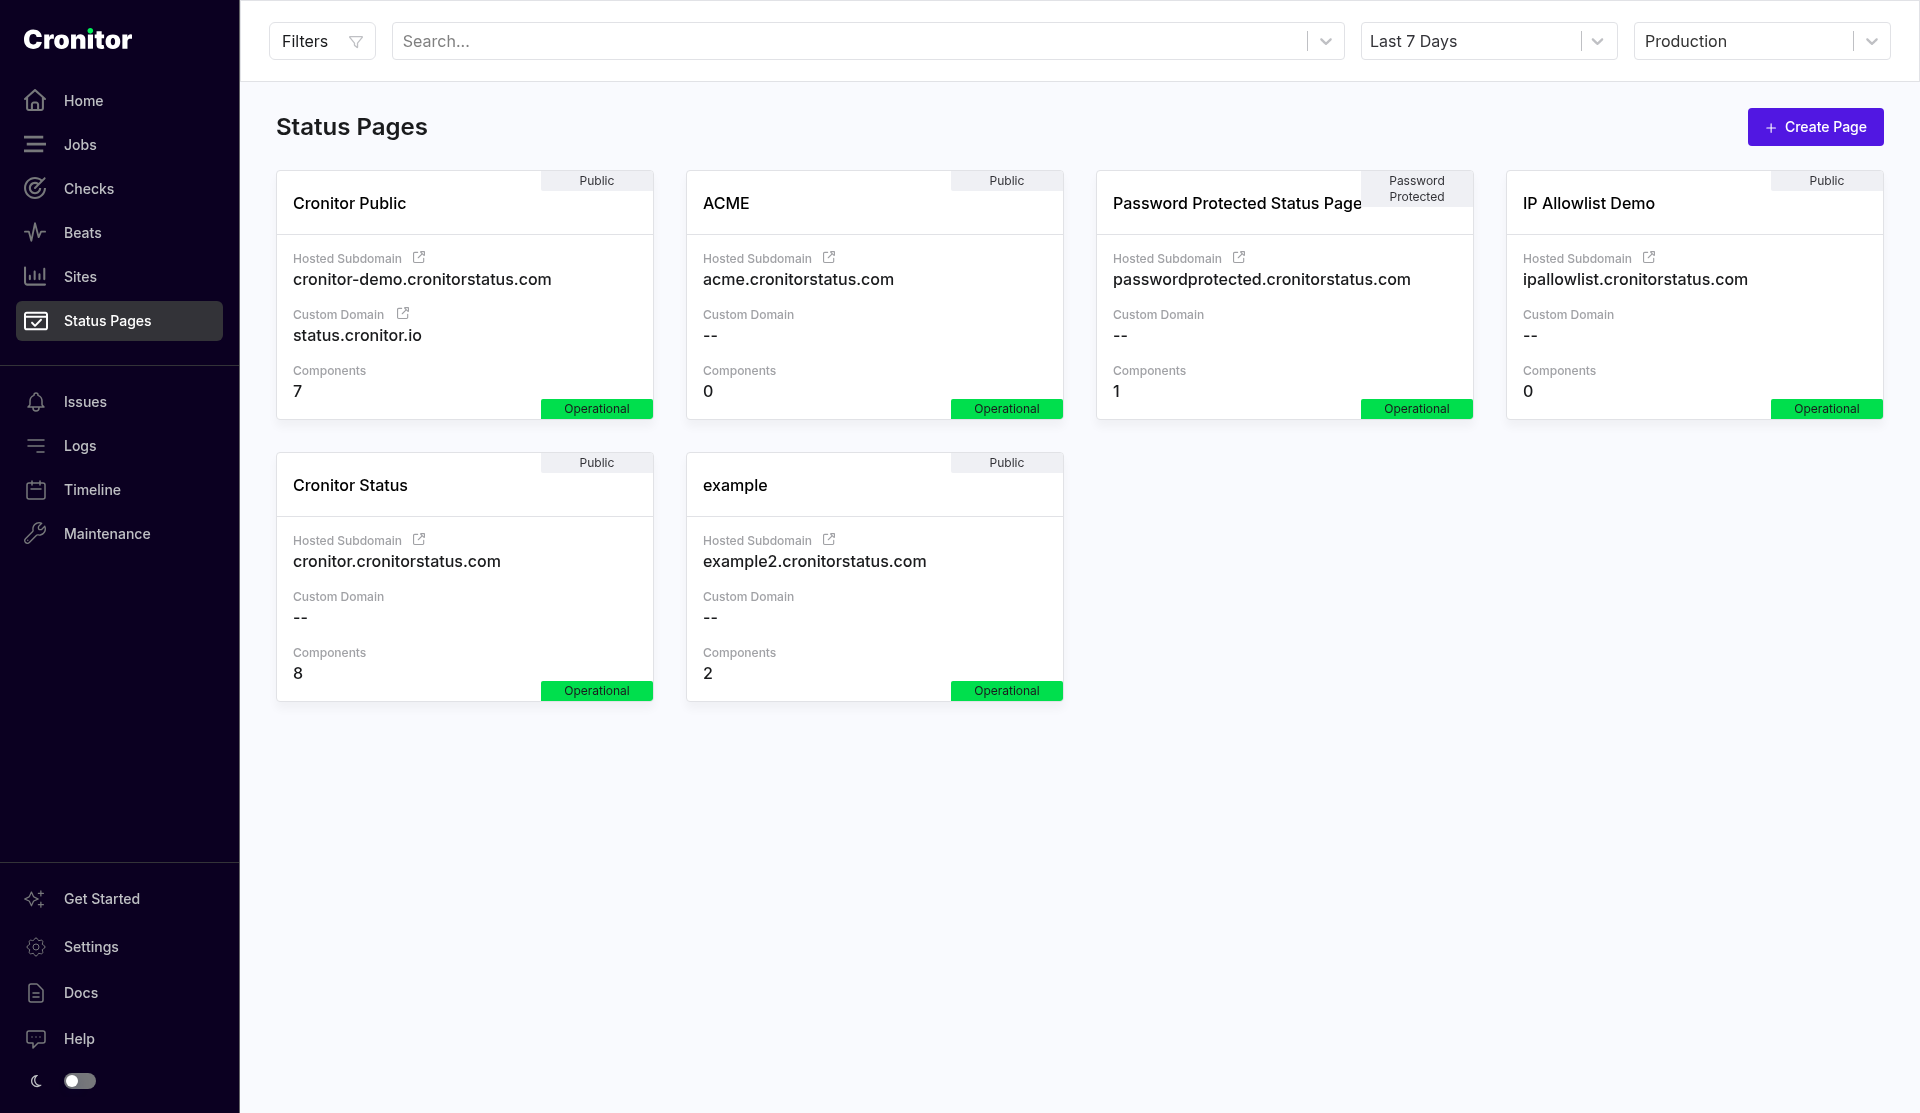
Click Create Page, or Full Configuration on an empty account. The form has three sections.
The Basics is the page name, an optional logo, and a dark mode switch.
Customization is your website URL, a support URL, an environment, the default time period (24h, 7d, 30d, or 90d), and Show performance metrics.
Deployment is the hosted subdomain, an optional custom domain, access, an IP allowlist, and search engine indexing. The save button is at the bottom of Deployment.
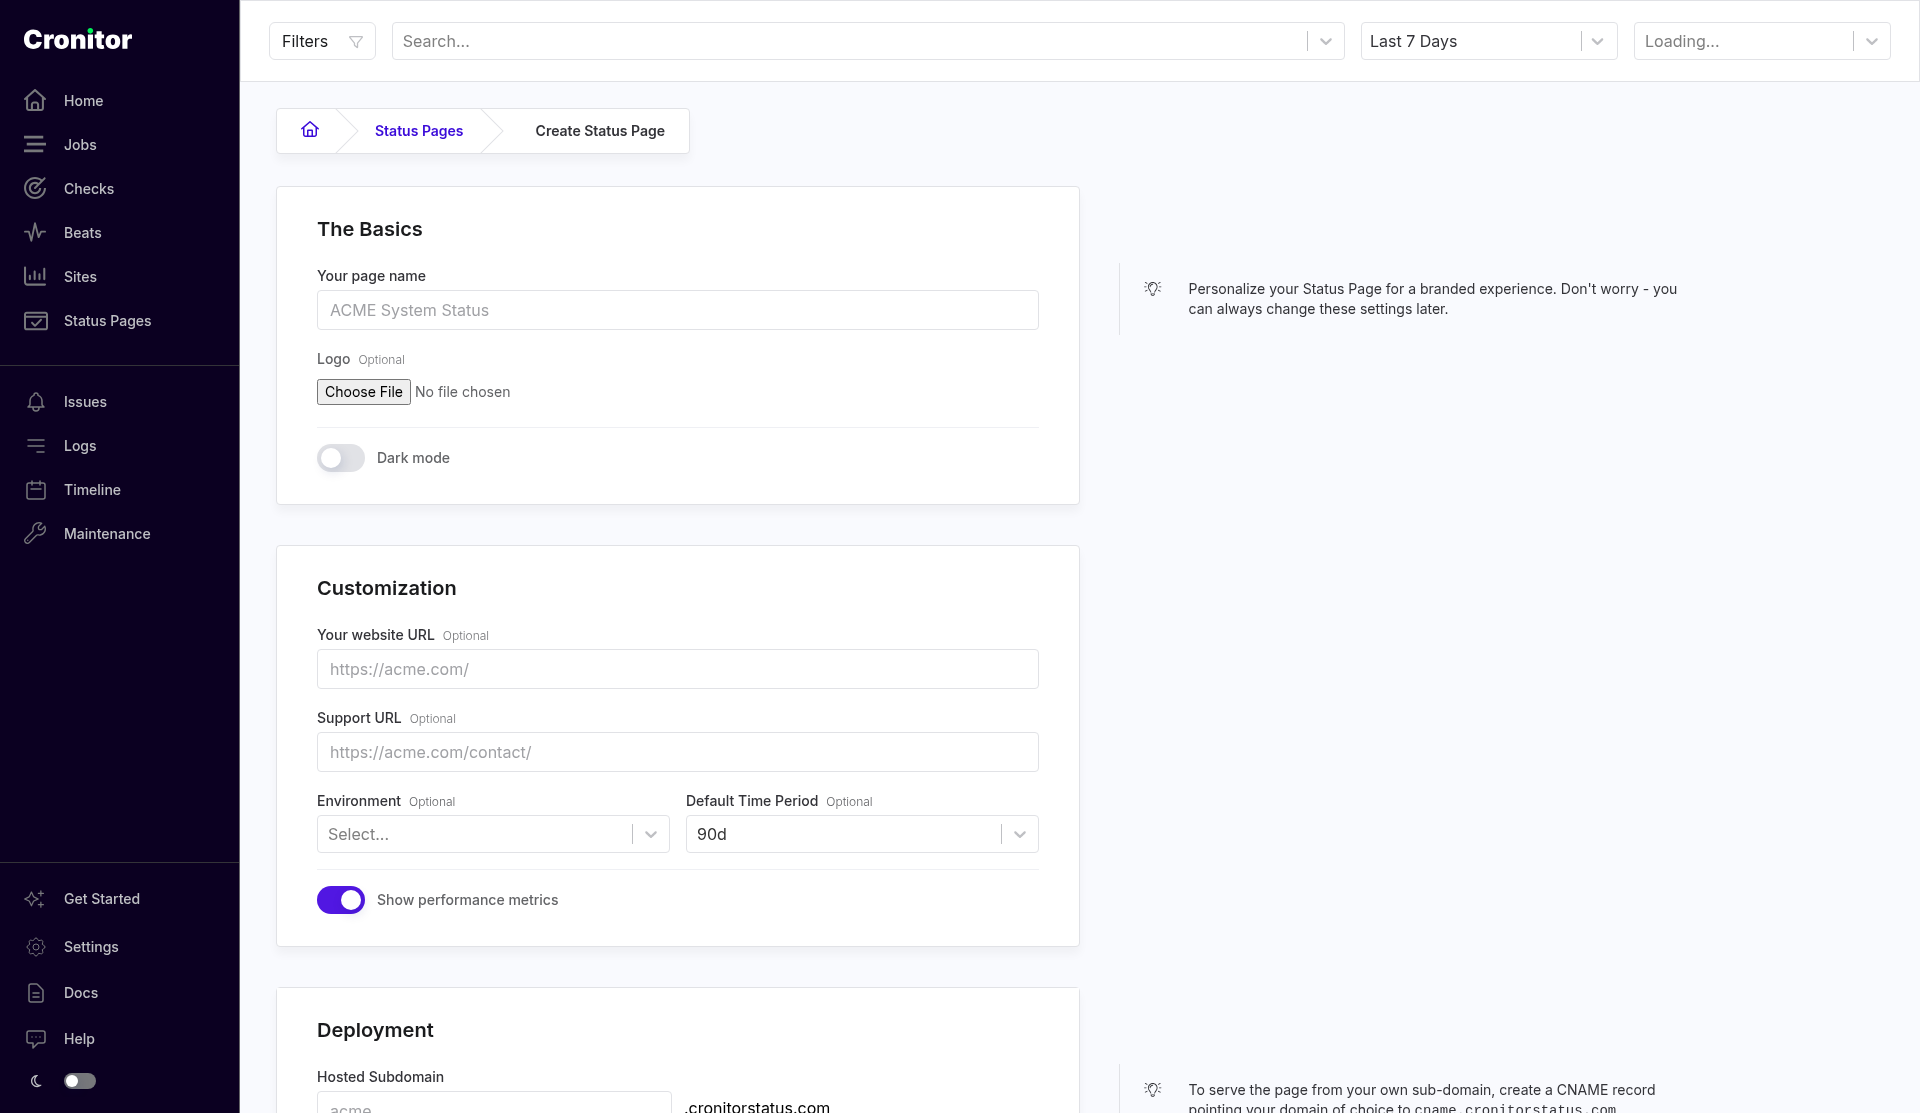
The page name is what visitors see at the top. The website URL and support URL are optional. The support URL is what turns on the Support button on the public page.
Pick a hosted subdomain. It has to be unique, and the public URL is https://<subdomain>.cronitorstatus.com. The form shows the suffix next to the field. You can open the page from that host immediately. A new page has no components yet, so visitors see an empty component list until you add some.
Click Save. Cronitor opens the status page detail screen: status and active incidents at the top, then Components, Incidents, and a sidebar with Status Page Details, subscribers, and badges. View Page next to the hosted subdomain opens the public URL.
Add components
A component is one row on the public page. It can be a check, job, heartbeat, or site, or a group of monitors. Add component also lists Create your own component under Non-automated. That row has no monitor, and you set its status yourself. Create a few monitors first if the account does not have any.
On the status page detail screen, use the Add component box in the Components section. Search for a monitor or group and select it. The row shows the type (Group, Check, Job, and so on), the current status, and buttons to edit or remove it. Drag a row to change the order.
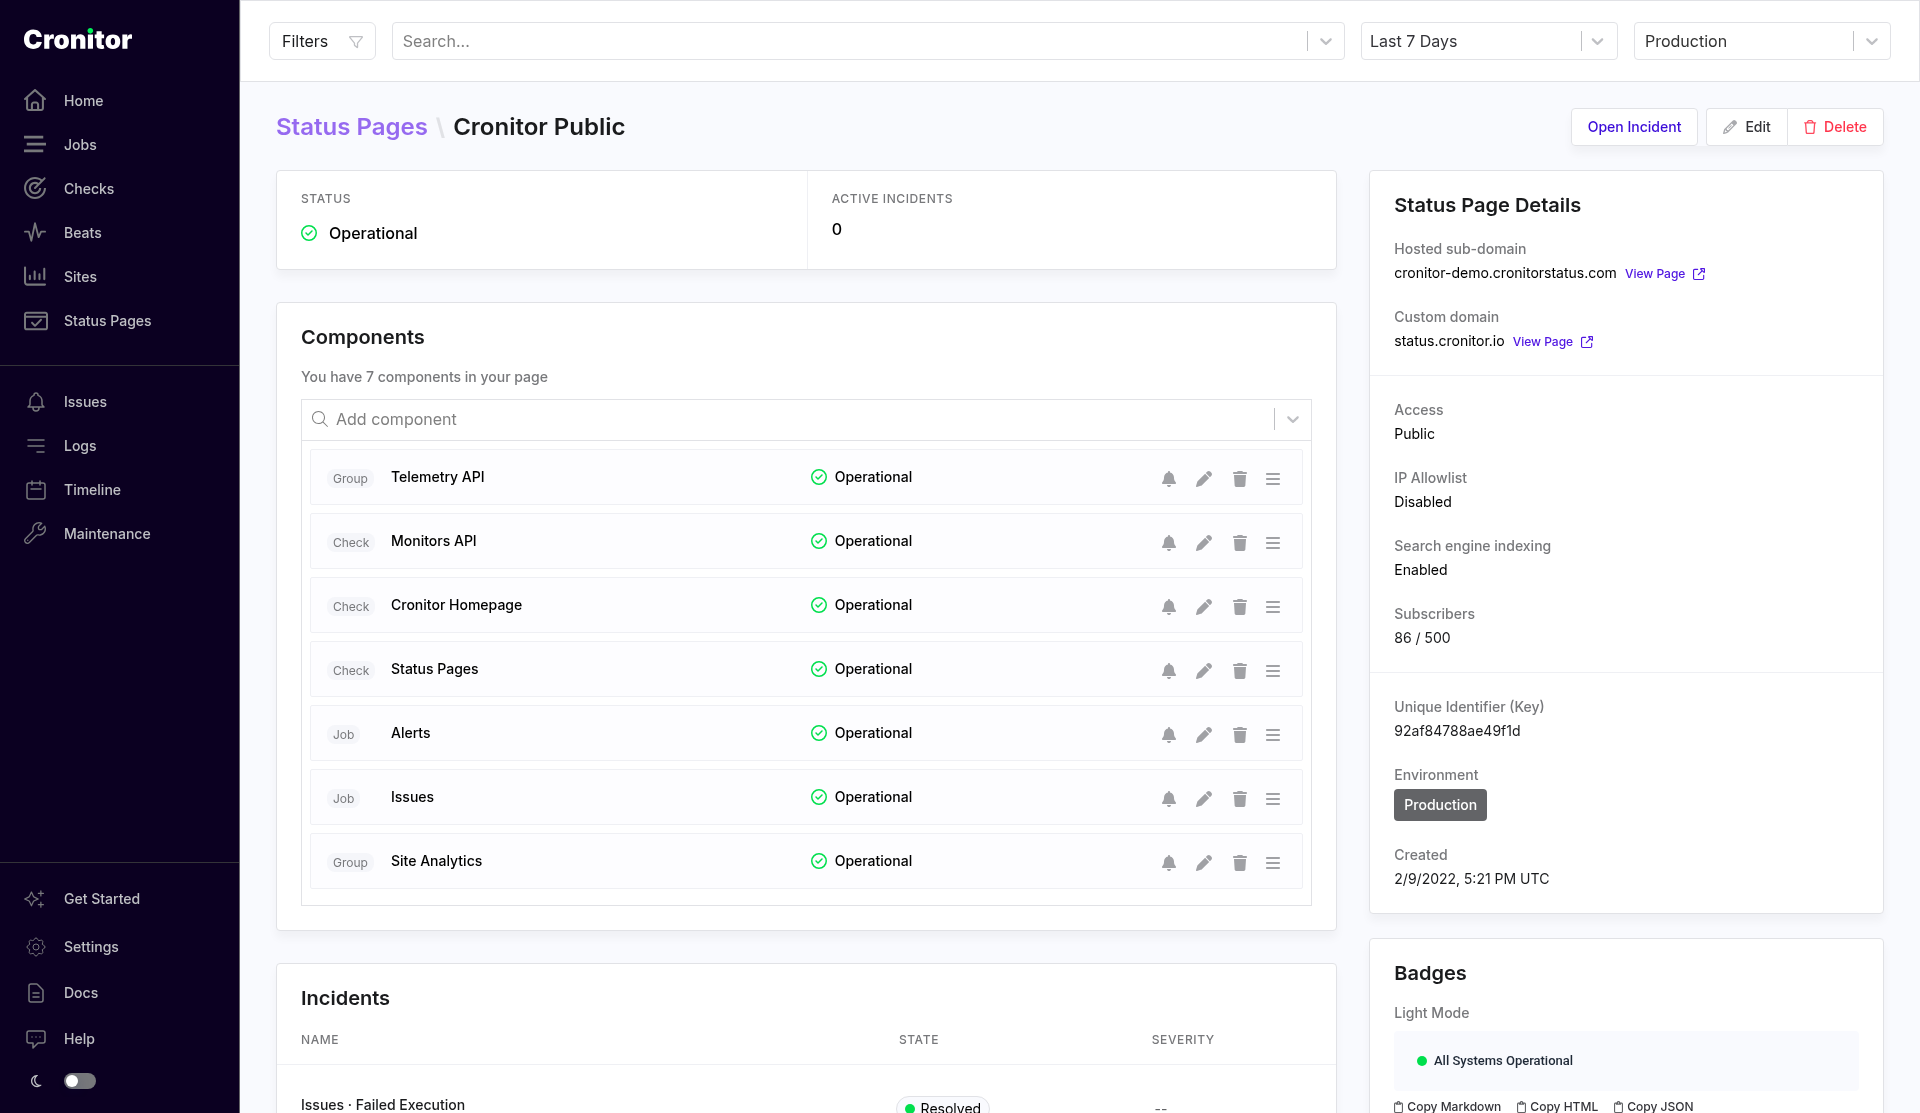
Open the pencil on a row if you want a different display name. The name on the monitor and the name on the status page do not have to match. That is useful when the internal monitor name is not what you want customers to read.
The public page then lists those components with an uptime bar. The header reads All Systems Operational when nothing is in an incident. Visitors can switch Uptime and Performance, and pick 24h, 7d, 30d, or 90d. The default period is whatever you set on the edit form.
Publish an incident
An incident on the status page is a Cronitor issue that you have published to one or more pages. The sidebar still says Issues. On the status page itself the button says Open Incident, and the list below the components is Incidents.
Click Open Incident on the status page. That opens Create Issue with this page already selected under Publish to Status Pages. You can add other pages there if the same incident should show up in more than one place.
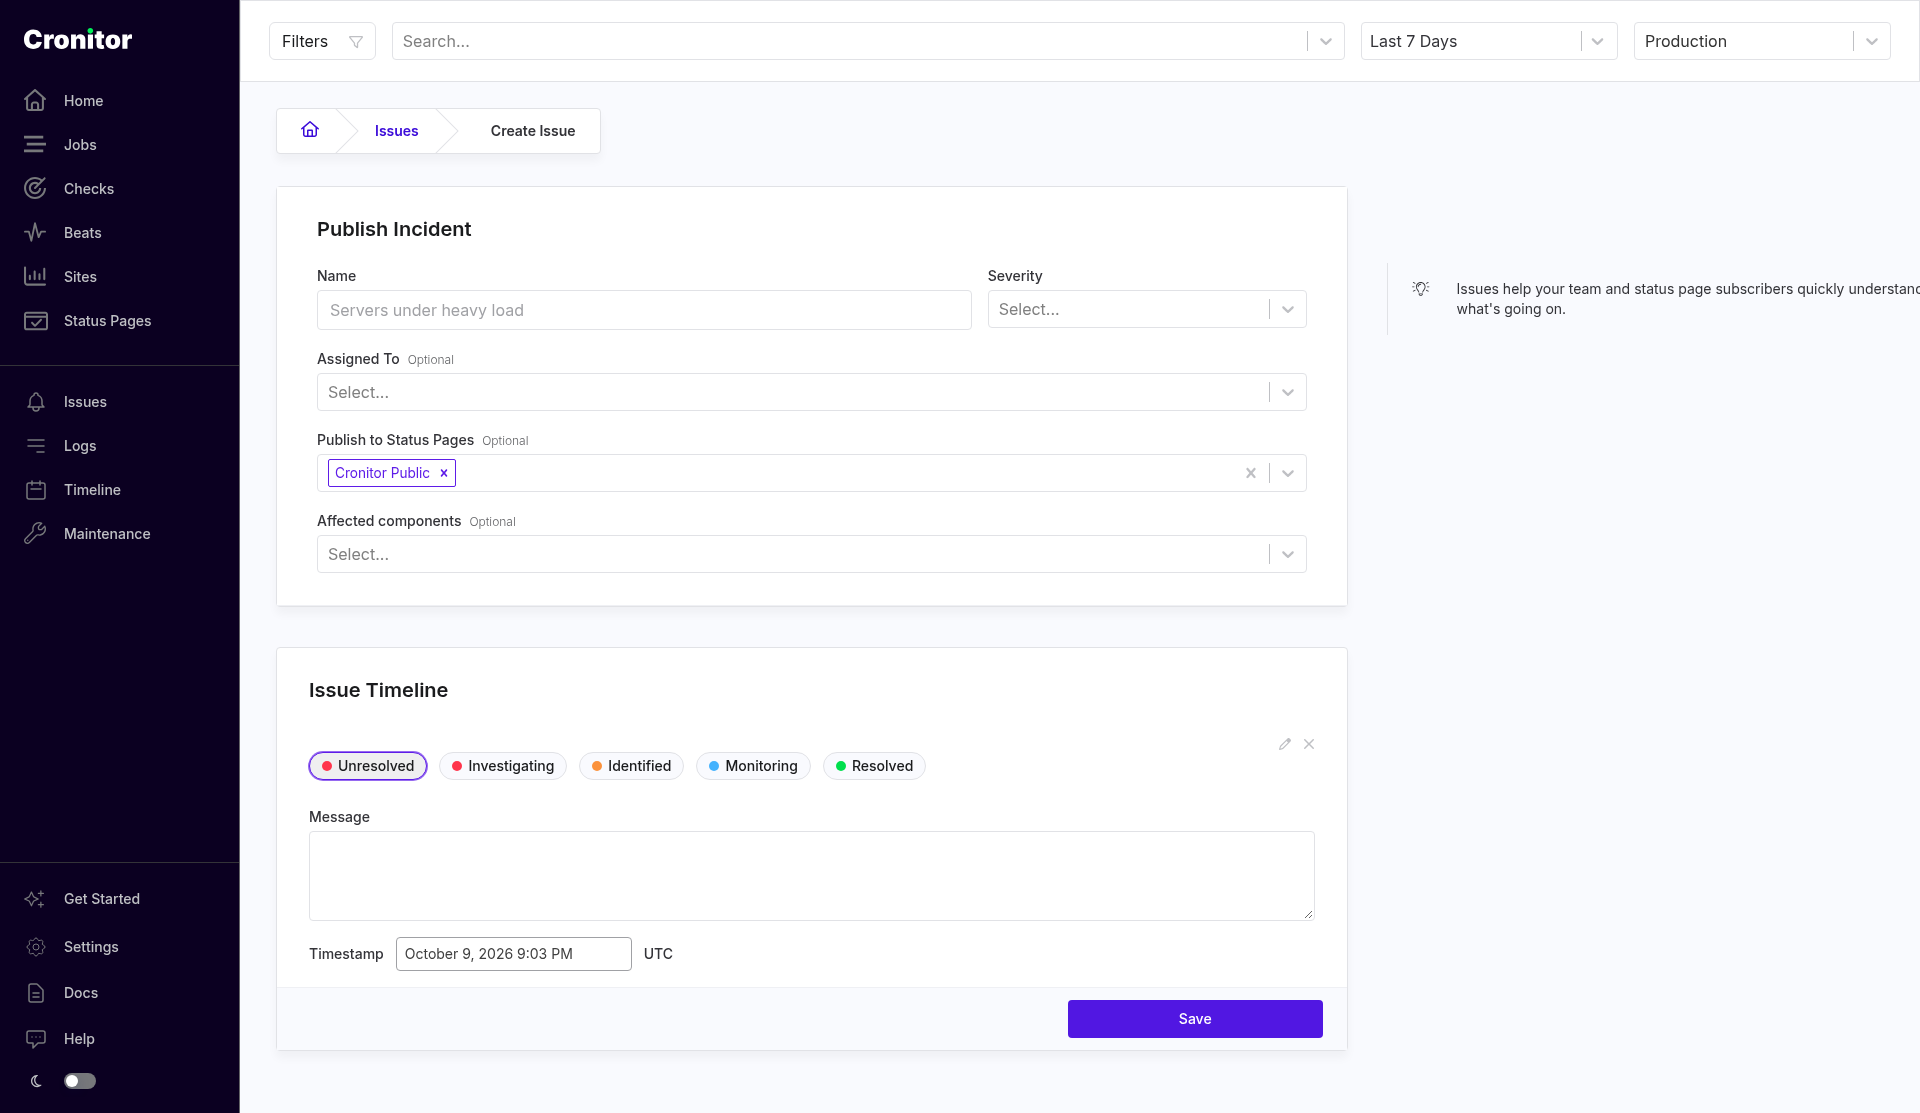
Set the name and, if you want, a severity and the affected components. The timeline update has five states: Unresolved, Investigating, Identified, Monitoring, and Resolved. A new issue starts as Unresolved. Write the customer-facing message in that box. Two that cover the usual first hours:
"Investigating: We have detected a server outage. The team is investigating."
"Monitoring: We identified the issue and deployed a fix. We are watching the servers to confirm it holds."
Click Save. The incident is listed on the status page detail screen and, because you published it, at the top of the public page. Each incident has a stable URL, so a link you send during the outage still works after you resolve it.
You can also start from Issues in the sidebar and choose the status page in Publish to Status Pages. Open Incident is the shorter path when you are already on the page.
Resolve an incident
Open the incident from the Incidents table on the status page, or from Issues. The issue screen has a State menu (Unresolved, Investigating, Identified, Monitoring, Resolved), an Update button, and an Add Update link in the Issue Timeline.

Choosing Resolved in the State menu closes the incident and adds a timeline entry. If you want a sentence on the public timeline, click Add Update (or Update), set that entry's state to Resolved, write the message, and save.
If a monitor on the issue is still failing, choosing Resolved opens a Reset failing monitors dialog so you can mark the selected monitors healthy at the same time. Leave them unchecked if the monitor should stay in a failed state.
After it is resolved, the incident leaves the top of the public page. It stays in Incident History.
Incidents opened by monitors
Adding a monitor creates a component with Automatically publish incidents on. The model default is on. When that box is checked, a failure opens an incident on the page, and recovery resolves it. Uncheck it on the component if you want the failure to stay on the Issues list until someone publishes it.
An incident does not have to come from a monitor. Open Incident is how you post a general outage or a maintenance window.
Incident history
On the public page, Incident History opens /history on the same host (https://<subdomain>.cronitorstatus.com/history).
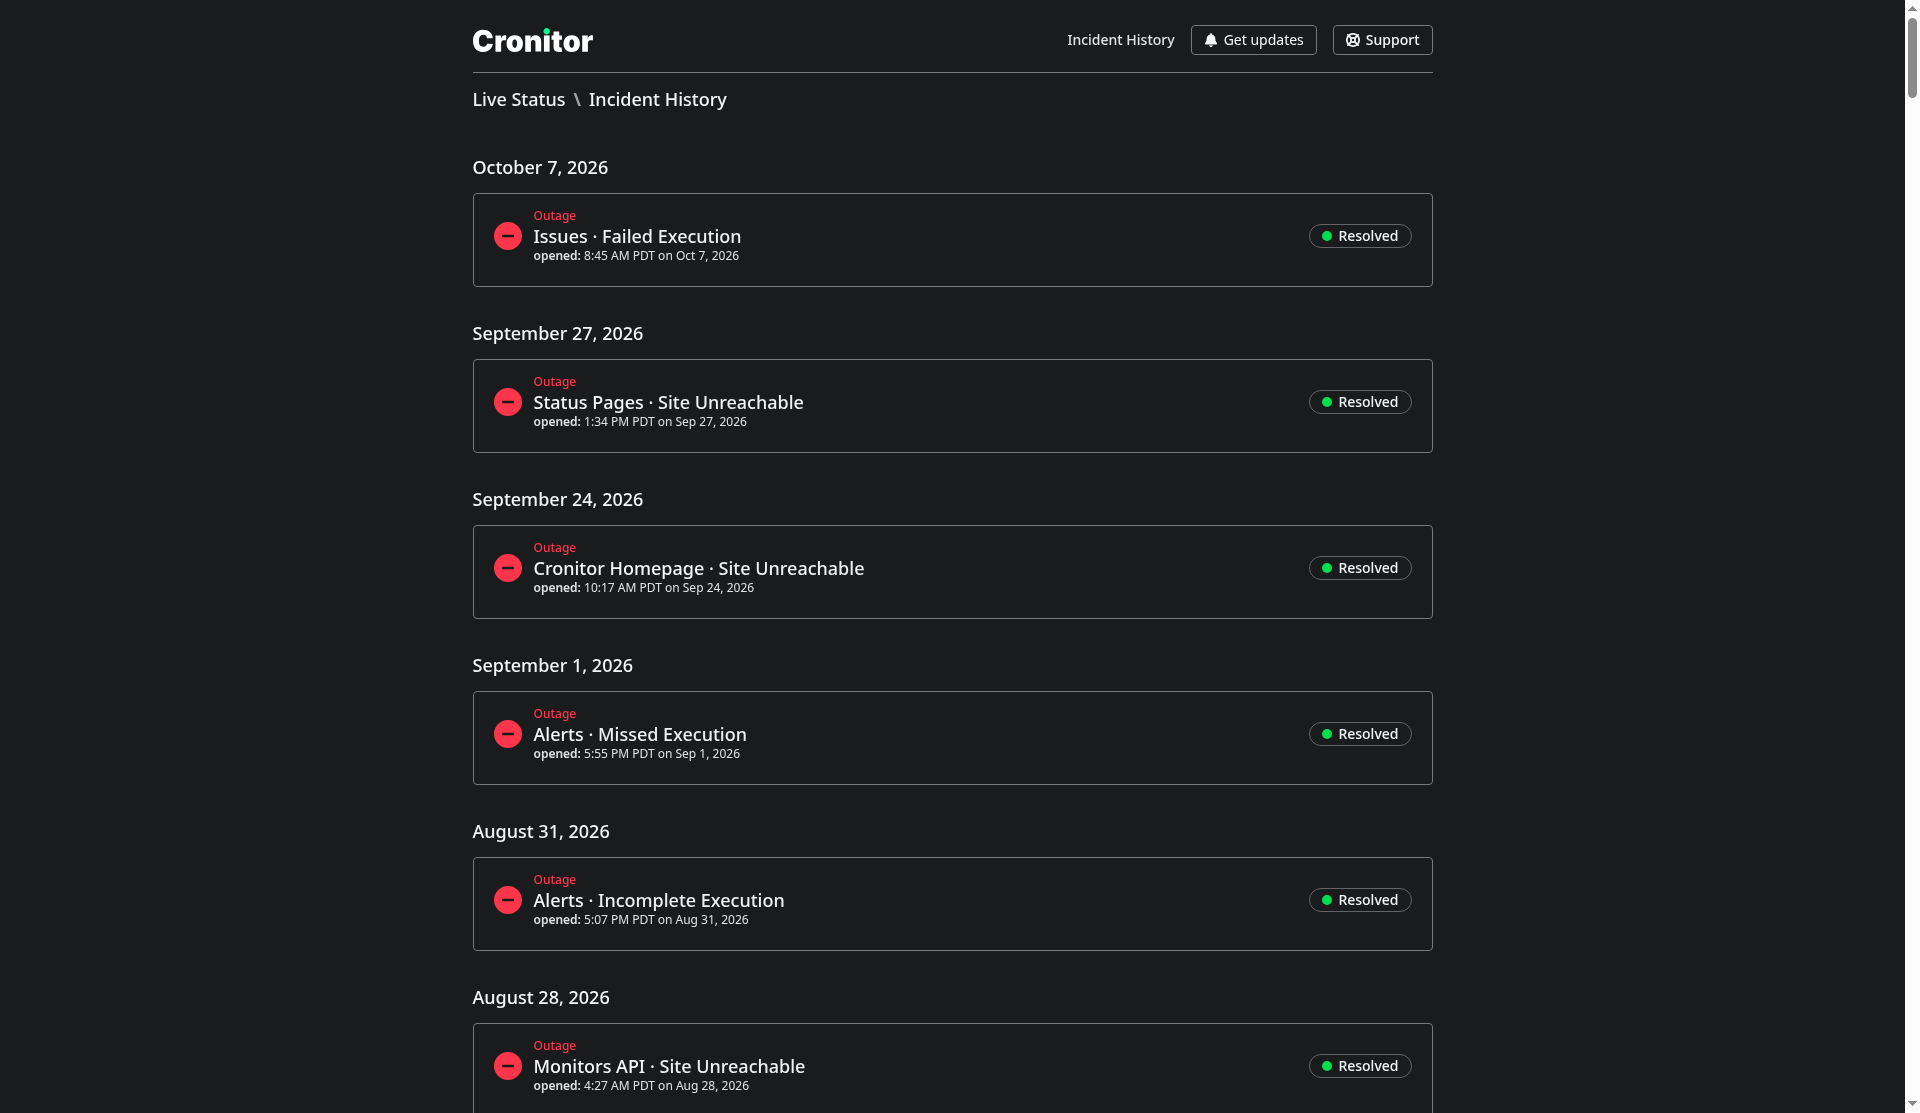
Use a specific incident's URL when you need to point someone at one outage. The path does not change when you edit the message or resolve it.
Uptime and performance
Uptime is the default view: a bar for each component and a percent for the range you selected. Groups show a bar too, and the label includes how many components are in the group.
Performance switches the bars for a chart. Checks show response time. Jobs show duration. Heartbeats are included in the same performance data. A group does not have a performance series of its own. In the screenshot, the Telemetry API group says "No data available". The charts below that group are other top-level components on the page: Monitors API, Cronitor Homepage, and Status Pages are checks, and Alerts and Issues are jobs. They are not the components inside the Telemetry API group.
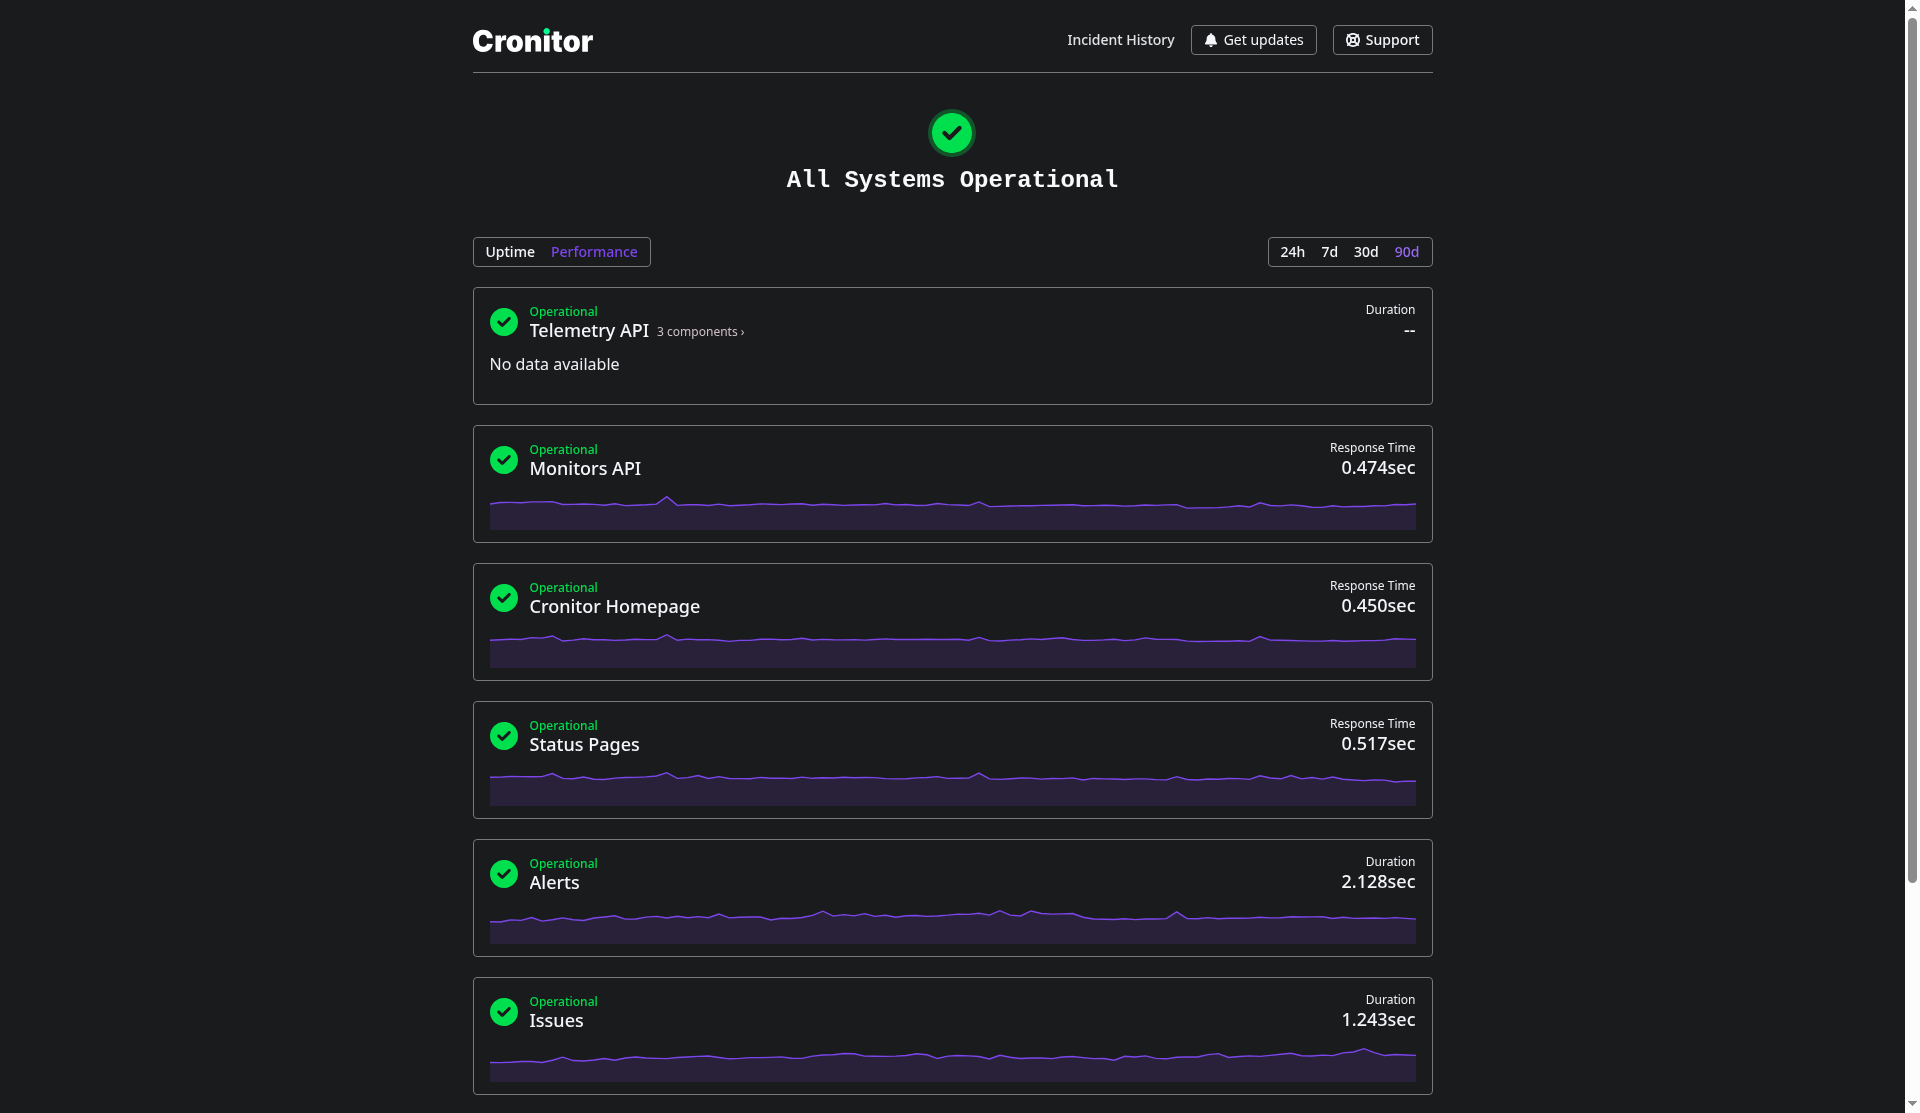
Show performance metrics on the edit form is what turns this tab on or off. The time-period control on the edit form sets which range is selected when the page loads.
Logo, dark mode, and support
Open the status page and click Edit. Branding is under The Basics and Customization.
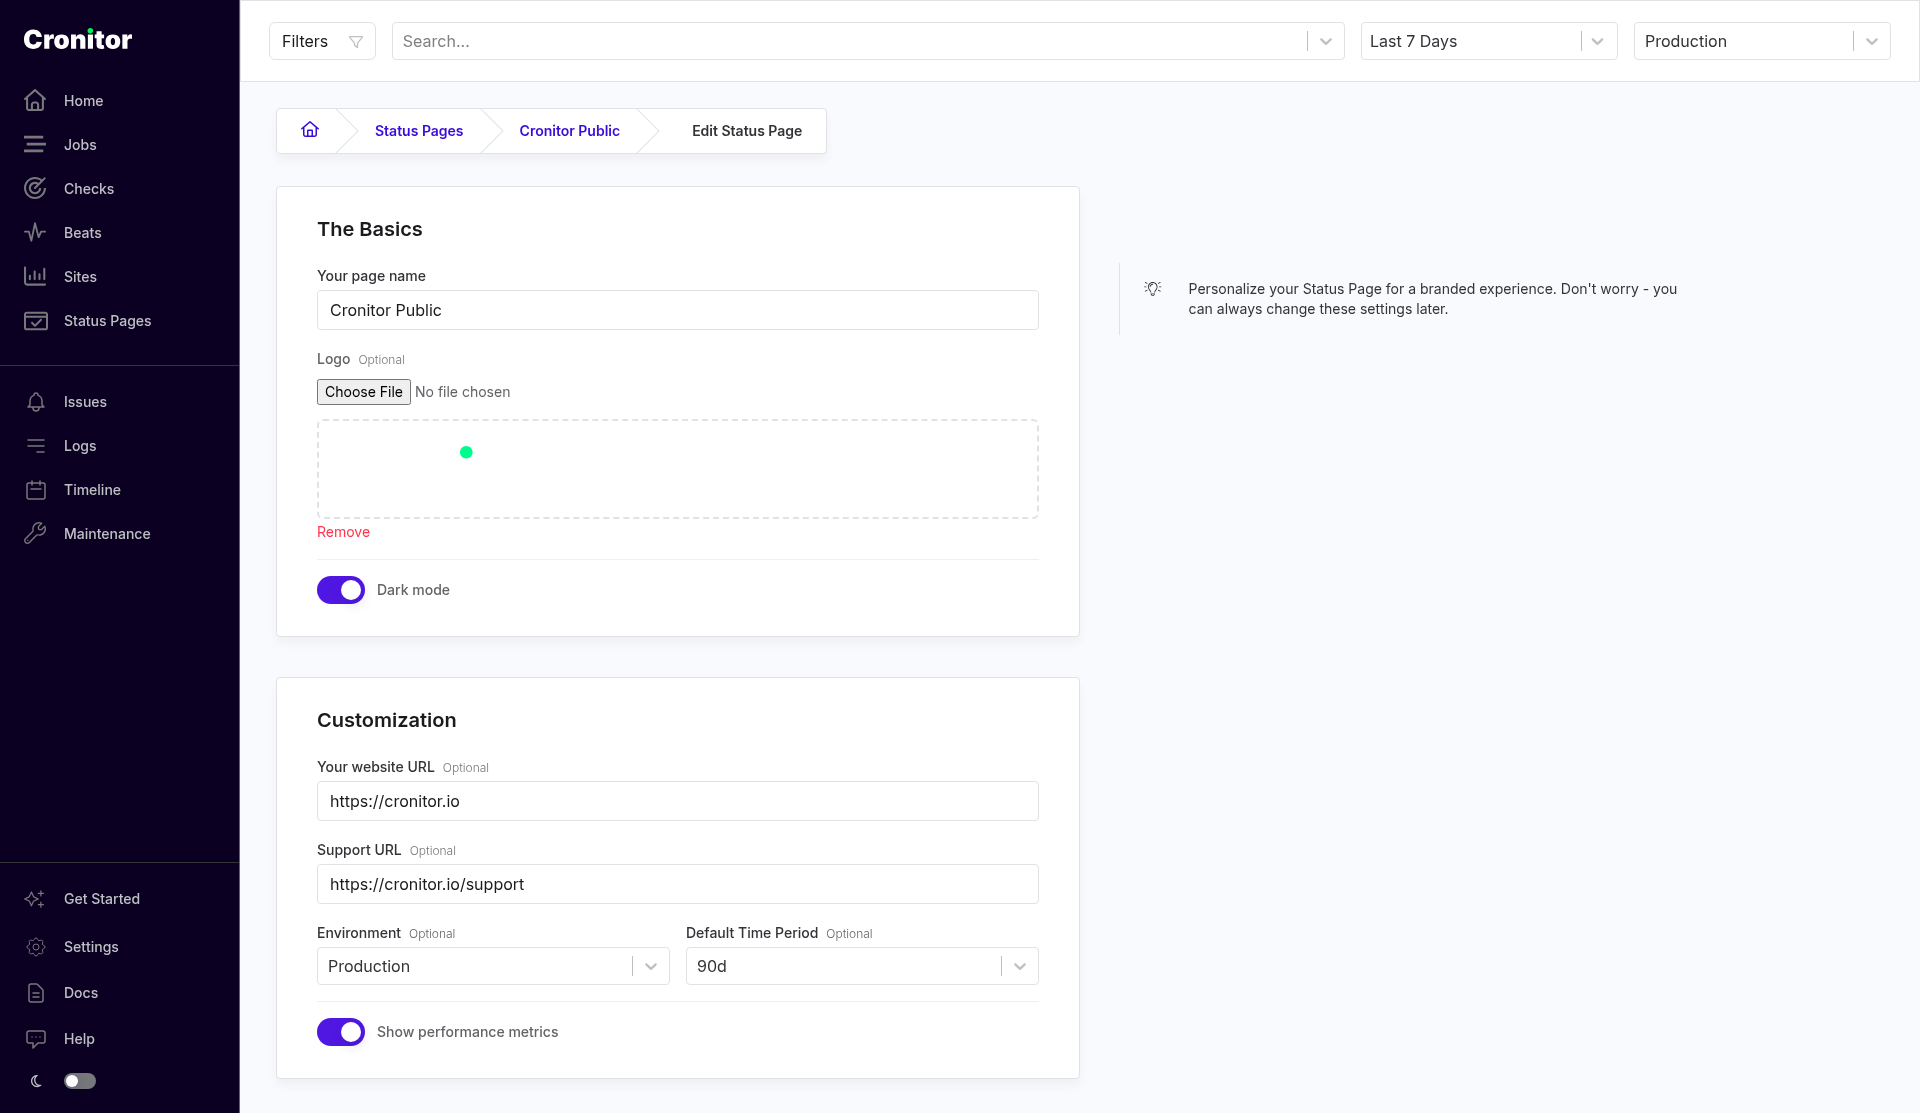
Logo uploads the image shown at the top of the public page. Dark mode is the switch for the public theme in the screenshots above. Your website URL and Support URL are the header links. Support URL is what the Support button uses.
On the free plan, Logo is labeled Upgrade Required. Branding (logo and custom domain) is the $25 per month add-on mentioned above. The screenshot is from a workspace where the logo field is available.
Save, then reload the public page. The logo sits at the top left.
The detail sidebar also has Badges, with copy buttons for Markdown, HTML, and JSON. That is a status snippet you can embed elsewhere. It is separate from the logo.
Custom domain
Every page gets a cronitorstatus.com subdomain. Most teams also serve it from their own host, such as status.example.com, so the page is obviously theirs.
Two steps:
- Set Custom Domain on the edit form, under Deployment.
- Add a CNAME at your DNS host. The form prints the record: name is the domain you typed, value is
cname.cronitorstatus.com.
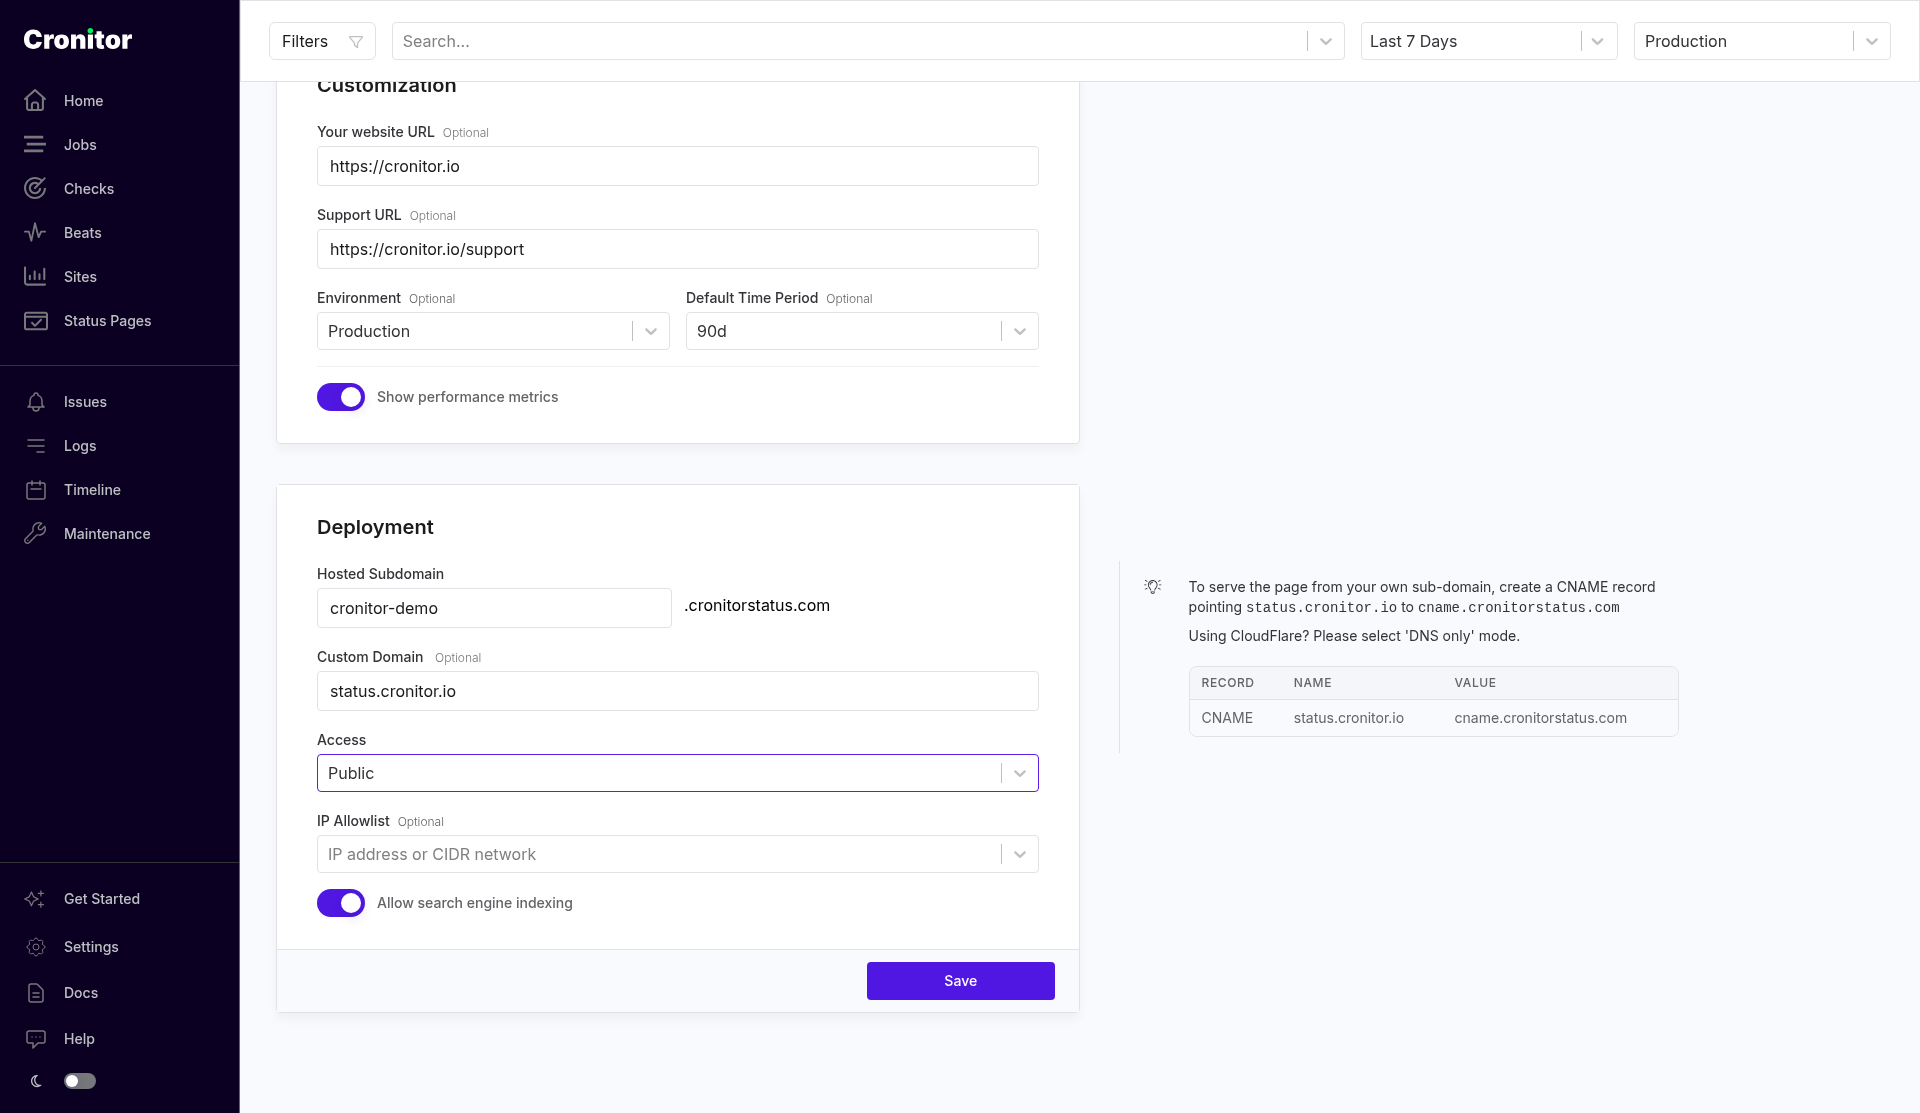
The custom domain has to be unique across Cronitor status pages. On the free plan the field is marked Upgrade Required.
If you use Cloudflare, set the record to DNS-only. A proxied record often breaks the page.
DNS can take anywhere from a few minutes to 24 hours to propagate. A DNS_PROBE_FINISHED_NXDOMAIN error in that window usually means the record is not visible everywhere yet. The DNS_PROBE_FINISHED_NXDOMAIN guide covers that browser error. If it is still broken the next day, email support and include the domain.
Password protection
Access on the edit form is Public or Password Protected. The IP allowlist is a separate field, covered next, and you can set it with either choice.
For a page that should not be public, set Access to Password Protected. A password field appears under the menu.
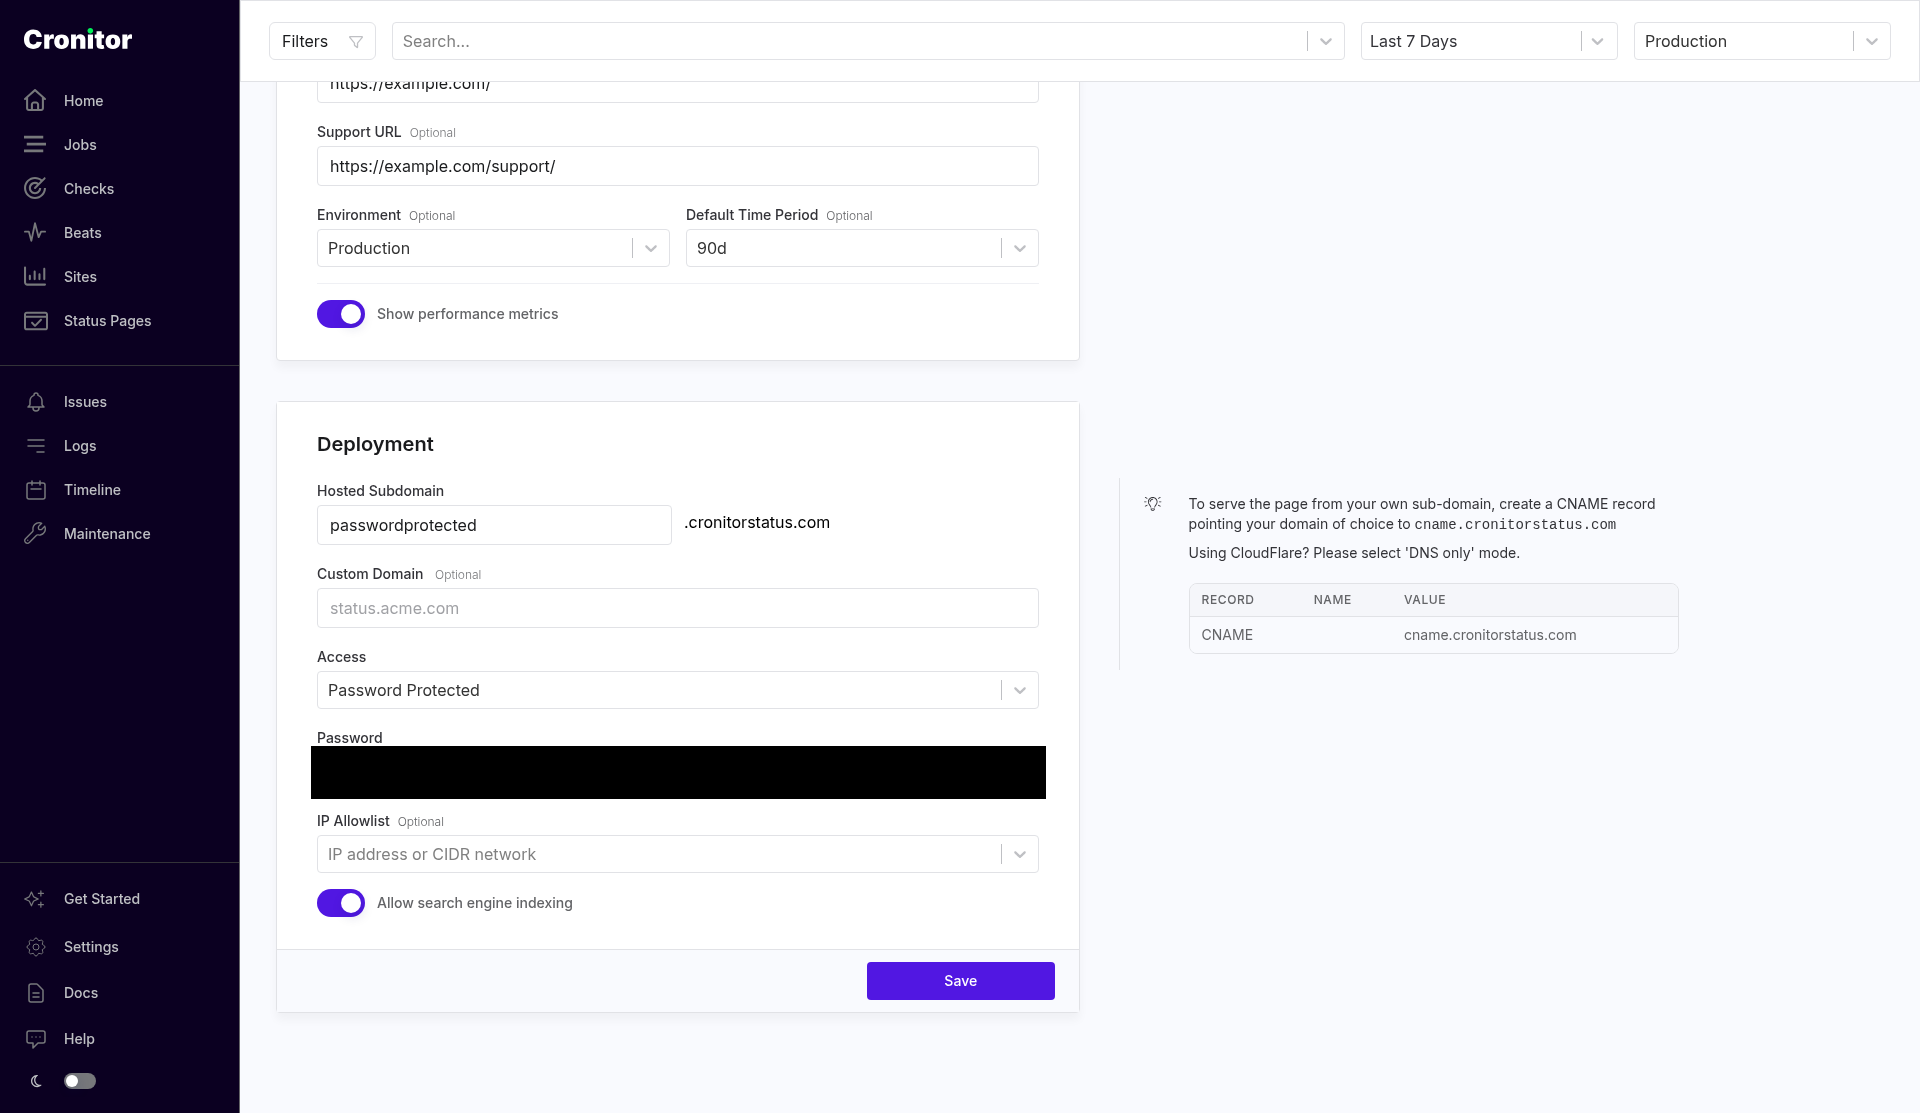
Save. Visitors have to enter the password before they see components or incidents. On the free plan the password field is marked Upgrade Required. Private pages are the $50 per month add-on.
After you save, open the hosted URL in a private window and confirm the prompt is what you expect.
IP allowlist
The IP Allowlist field takes one or more IP addresses or CIDR networks, IPv4 or IPv6. It is optional. It applies whether Access is Public or Password Protected. A page can require a password, an allowed network, or both.
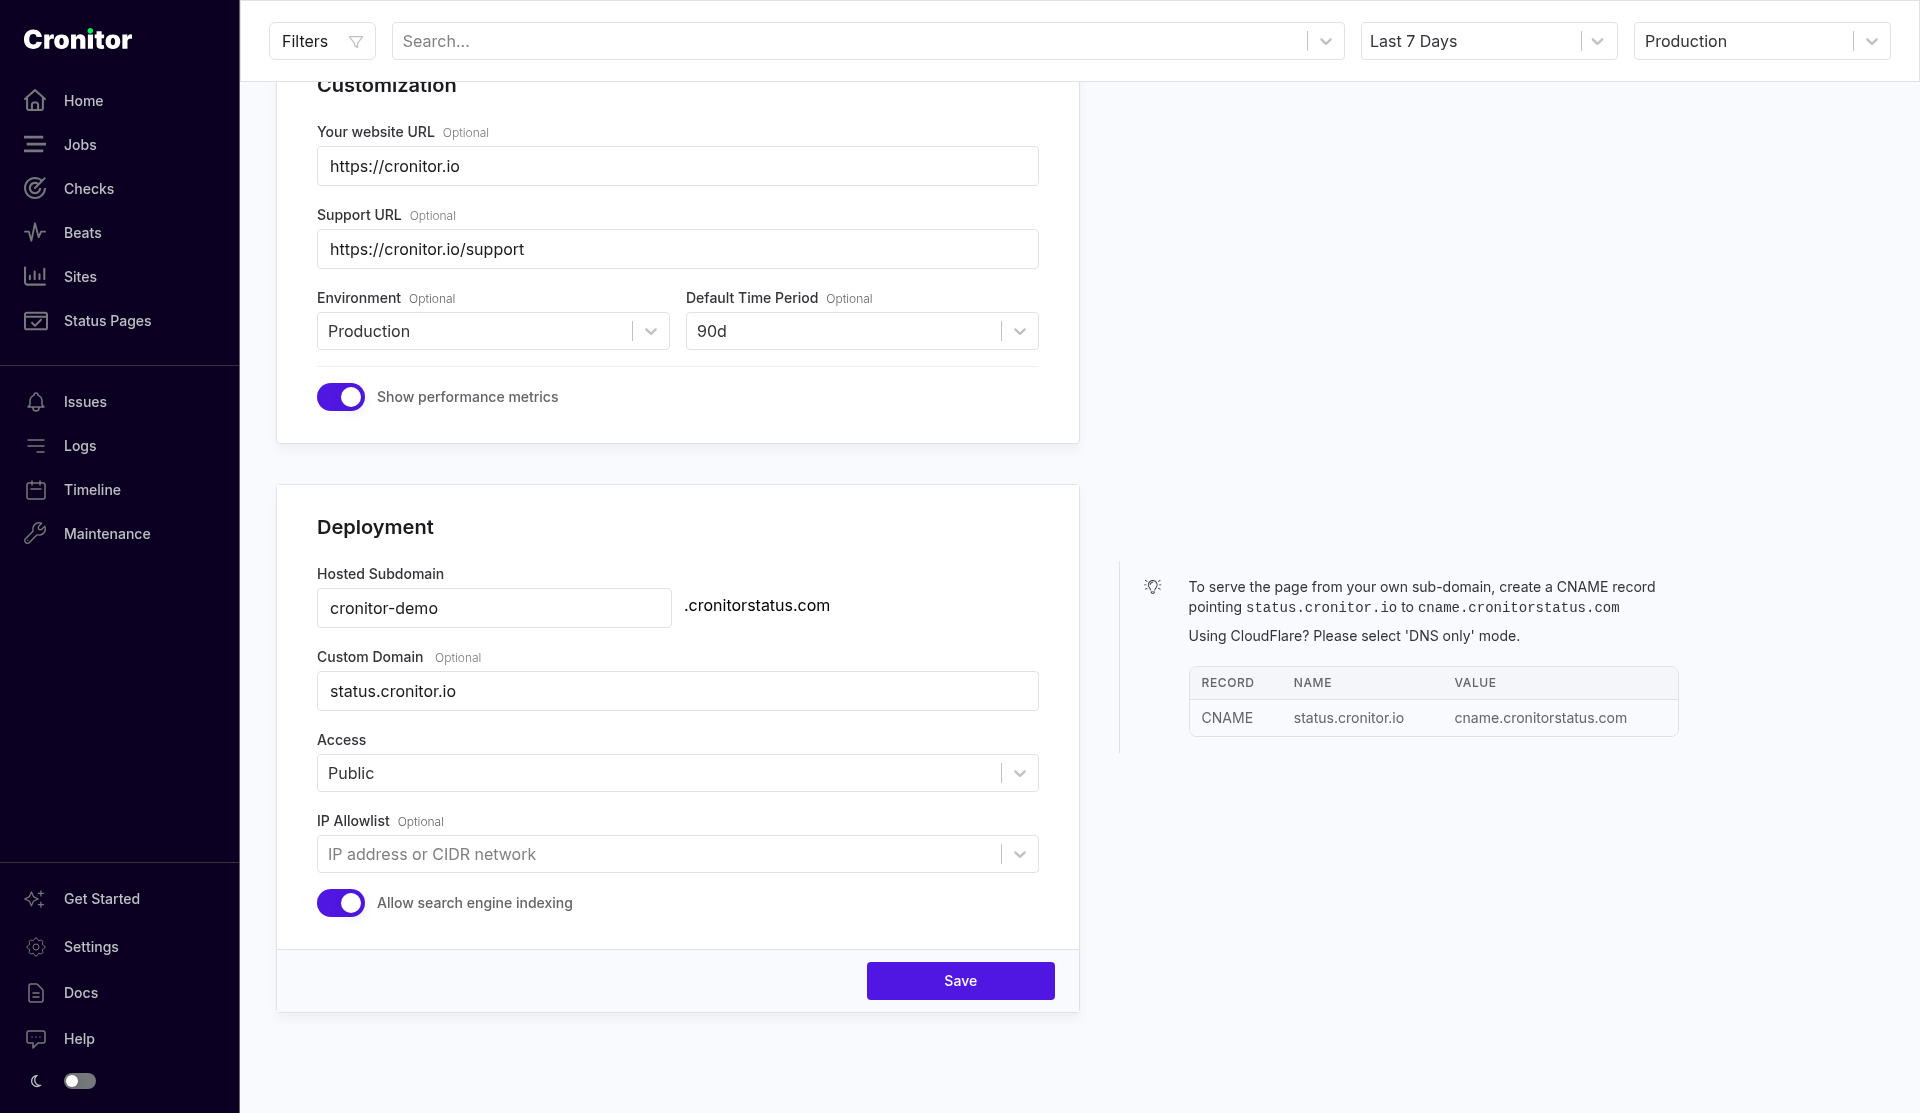
On the free plan the field is marked Upgrade Required, same private-page add-on as the password.
Requests that are not on the list do not get the component list, metrics, or incident text. Check it from an address that is not in the list before you send the URL to the office.
The detail sidebar shows whether the allowlist is enabled.
Component descriptions
The pencil on a component opens Edit component. Display name is the public label. Description is optional. Automatically publish incidents is the checkbox from earlier. Custom components, the ones you update by hand, do not show that checkbox.
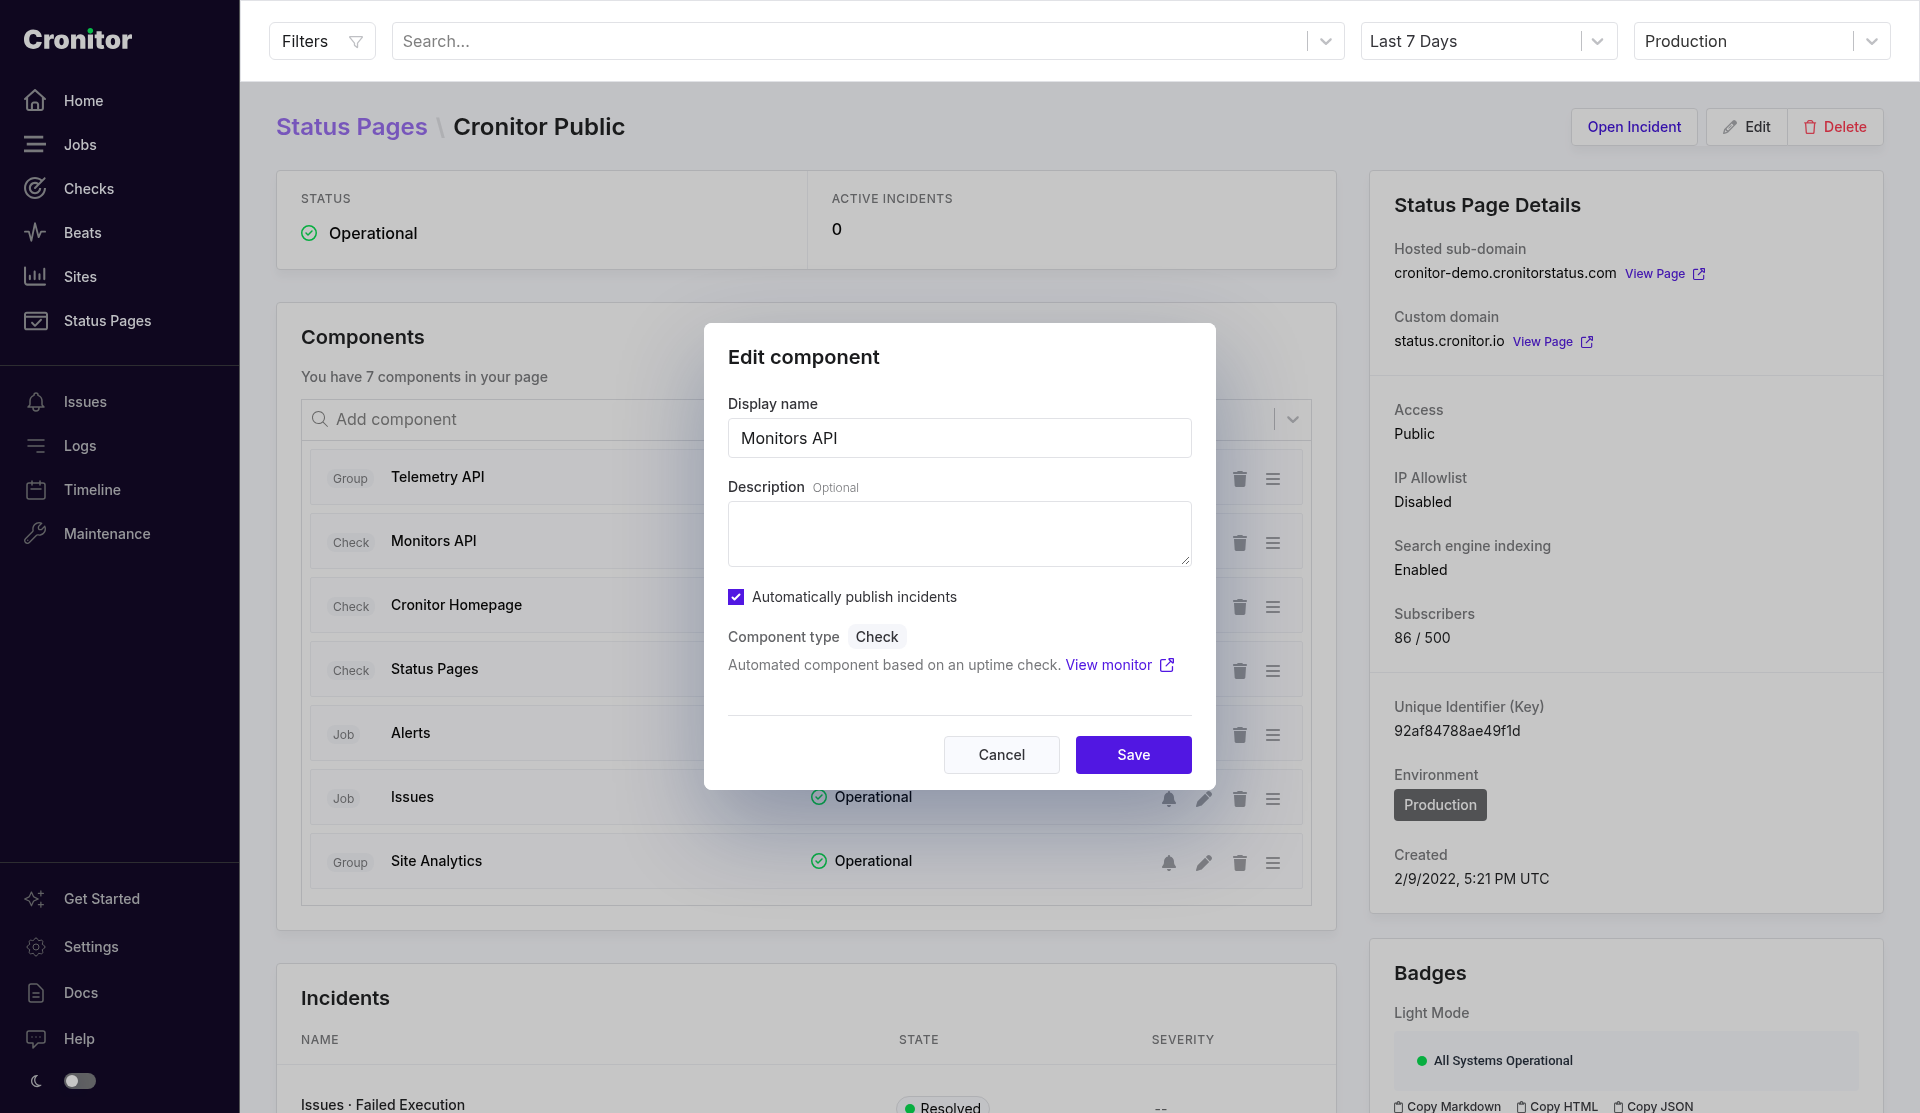
Save, then reload the public page. If the description is set, an info icon next to the component name shows it on hover. A useful description says which URL a check hits, or what a customer should do when that row is red.
Subscriptions and RSS
Get updates on the public page opens a dialog. The tabs are E-mail, RSS, and Webhook. Slack is included when Slack subscriptions are configured and the page is public. The RSS feed is on the same host at /history/rss. When the page is at its subscriber cap, the header button is RSS Feed instead of Get updates.
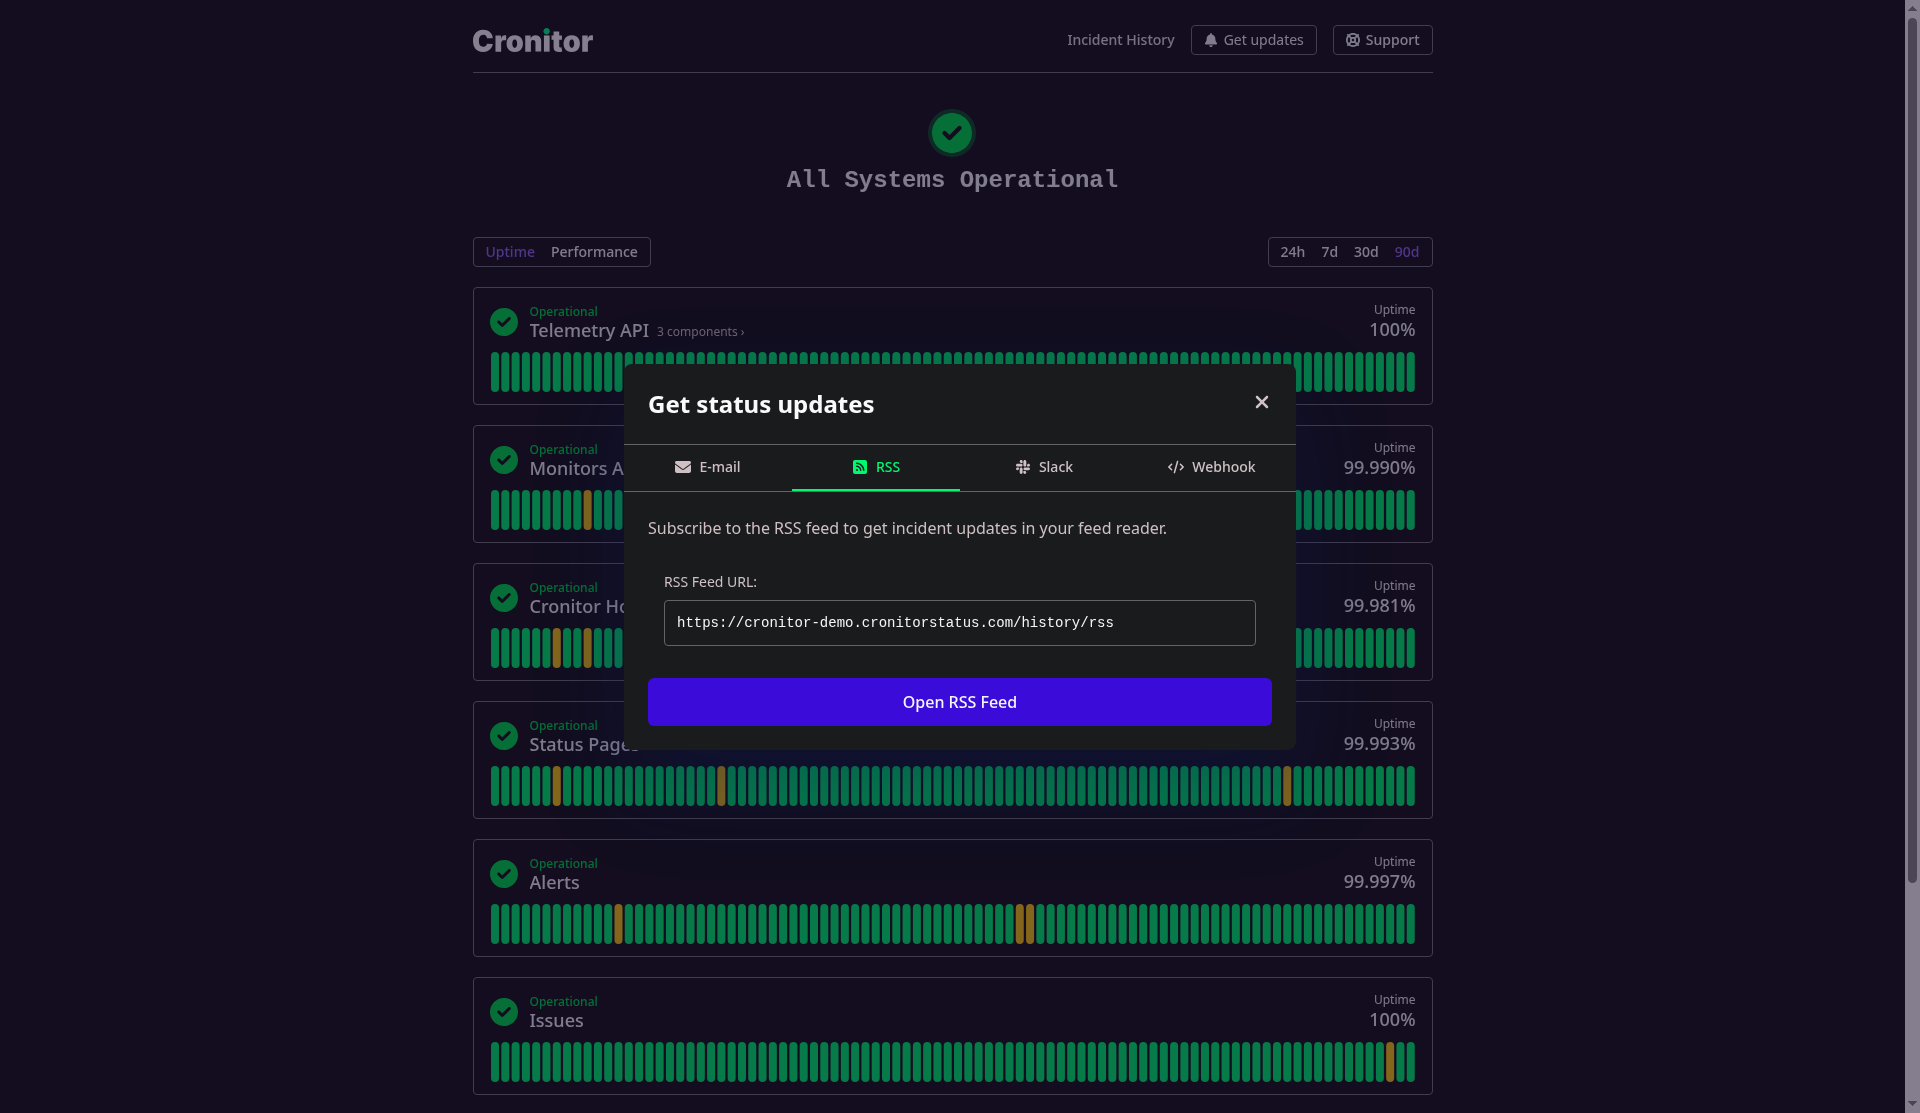
The status page docs cover pointing a Slack, Teams, or Discord channel at the feed. Subscriber counts on the detail page are against the plan cap: 50 on the free plan, 500 on Business.
Where to go next
You now have a page, components, a way to publish and resolve an incident, and the controls for domain and access.
Create a free account if you do not have one. For the wording of the updates, use the incident templates. For how other companies lay out a public page, see status page examples.