Web Performance Monitoring
Website Performance Metrics | An Actionable Guide
Website performance is not about having high scores in some artificial benchmark. It's about ensuring you deliver a great user experience.
If you're building a product or business, it's crucial to always deliver a great end user experience. Frustrated visitors are more likely to abandon the site, and it has a direct impact on conversions and retention.
But with hundreds of metrics available, it's often difficult to know where to focus your efforts and avoid wasting time on vanity metrics.
In this guide I'll cover some of the most important website performance metrics to keep an eye on, and how to make the most out of them.
Why website performance matters
Many companies have found that a fast, responsive website can significantly boost your conversion rate and sales. For example, Amazon found that for every 100 milliseconds it reduced on page load time, it increased sales by 1%.
A 1% increase in annual sales for Amazon translates into billions of dollars in additional revenue alone, not to mention that faster websites lead to less frustrating experiences, which may in turn translate into more returning users down the line.
Also, Google has incorporated many of these metrics as part of its ranking algorithm, as they are directly related to how frustrated a visitor might be when sent to your website.
That's why, I believe that ensuring a great end user experience will be more important than ever in 2023 and beyond.
How to interpret website performance metrics
I recommend a top down approach to website performance monitoring. Focus on the metrics most impactful to user experience first, and only dive into page load time optimization once you've done that.
For example:
- Start by measuring your Core Web Vitals. This helps you understand your page experience from the perspective of your end users.
- Then look at your Lighthouse scores and its suggestions. They're often very actionable and pragmatic.
- Once you understand which factors impact your page experience the most. Deep dive into technical metrics such as page load time in order to troubleshoot performance bottlenecks, and what might be causing issues on your site.
Next, let's look at the complete list of metrics and what they mean.
Core Web Vitals
Core Web Vitals are some of the most important metrics to measure for page experience. They were first proposed by Google as a way to measure how visitors experience a website.
If you want to have the best chance to rank higher than your competitors on search results, you should ensure that your site's Core Web Vitals fall within the recommended thresholds:
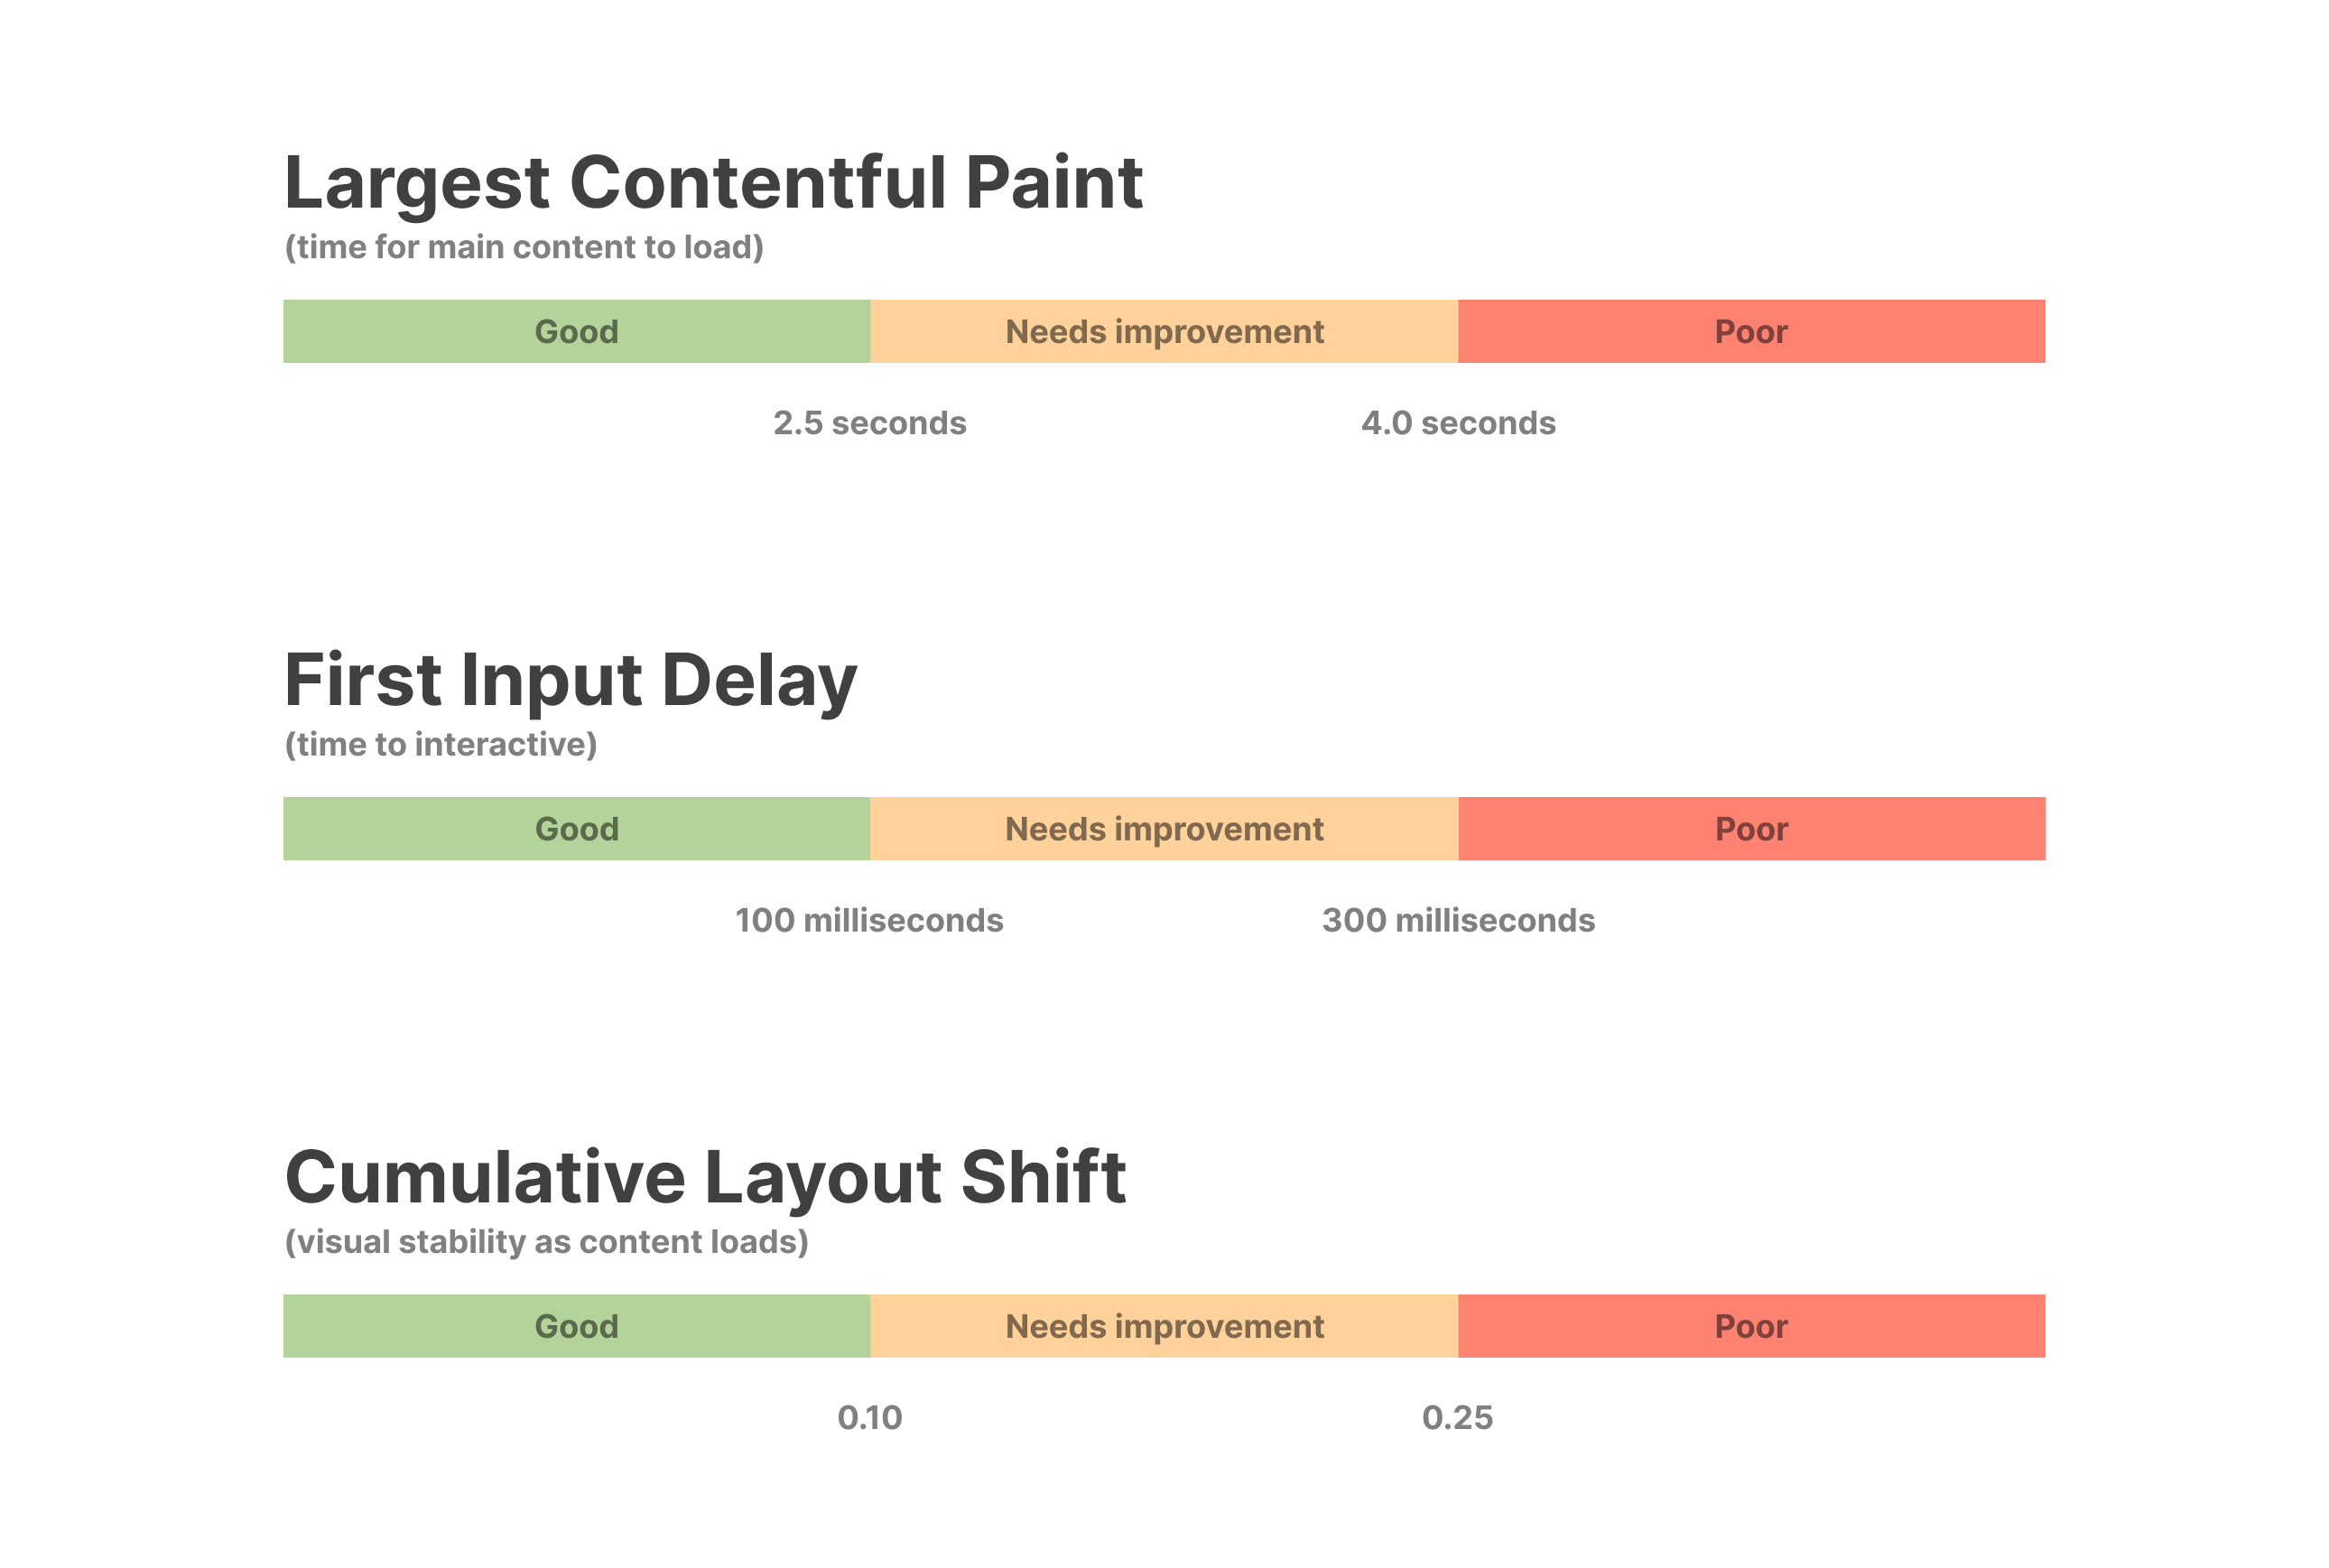 Core Web Vitals best practices.
The key insight is that Web Vitals measure the page experience, as opposed to just load time figures. Page load time often measures site speed from a purely technical perspective, and may not be representative of what really happened from the perspective of the user.
What does that mean?
For example, if the main content of a page has already loaded (eg. the blog post and images), but some background Javascript resources are still loading, one could argue that the page experience hasn't been significantly impacted by that script which hasn't yet loaded.
In this example, the page load time would look very high, while in practice the visitor has already started reading the main piece of content, so there's no material impact on the experience.
1. Largest Contentful Paint (LCP)
Largest Contentful Paint is a metric that measures how long it takes for the main piece of content to load on the screen.
A LCP of 2.5 seconds or less is considered good, while a score of 4 seconds or more may lead to a poor experience.
2. Cumulative Layout Shift (CLS)
Cumulative Layout Shift (CLS) measures the visual stability of a website. In other words, it measures by how much the main elements shift around as the page loads.
Google recommends a CLS of 0.1 or less. Usually the lower the better. If this score is too high it can lead to frustrated visitors, who may attempt to click on one button only for the element to move around as the rest of the page loads.
3. First Input Delay (FID)
First Input Delay measures input delay. In other words, it measures how quickly a user can start interacting with a website, even if it’s still loading.
To make your site feel snappy, a FID of 100 milliseconds or less is advisable, while an input delay larger than 300 milliseconds may lead to a degraded experience.
Lighthouse Scores
Lighthouse is an open source tool often used in Chrome DevTools to create automated reports on the quality of a web page. What makes this tool particularly useful is that it gives you suggestions on how to improve your scores.
Why is this important? It's generally a good enough indicator of what search engines such as Google might evaluate when ranking your site.
Even if your performance is great, you want to ensure your site is accessible, follows best practices, and has good SEO scores. This not only helps search engines understand the content on your site better, but directly affects how people interact with your site.
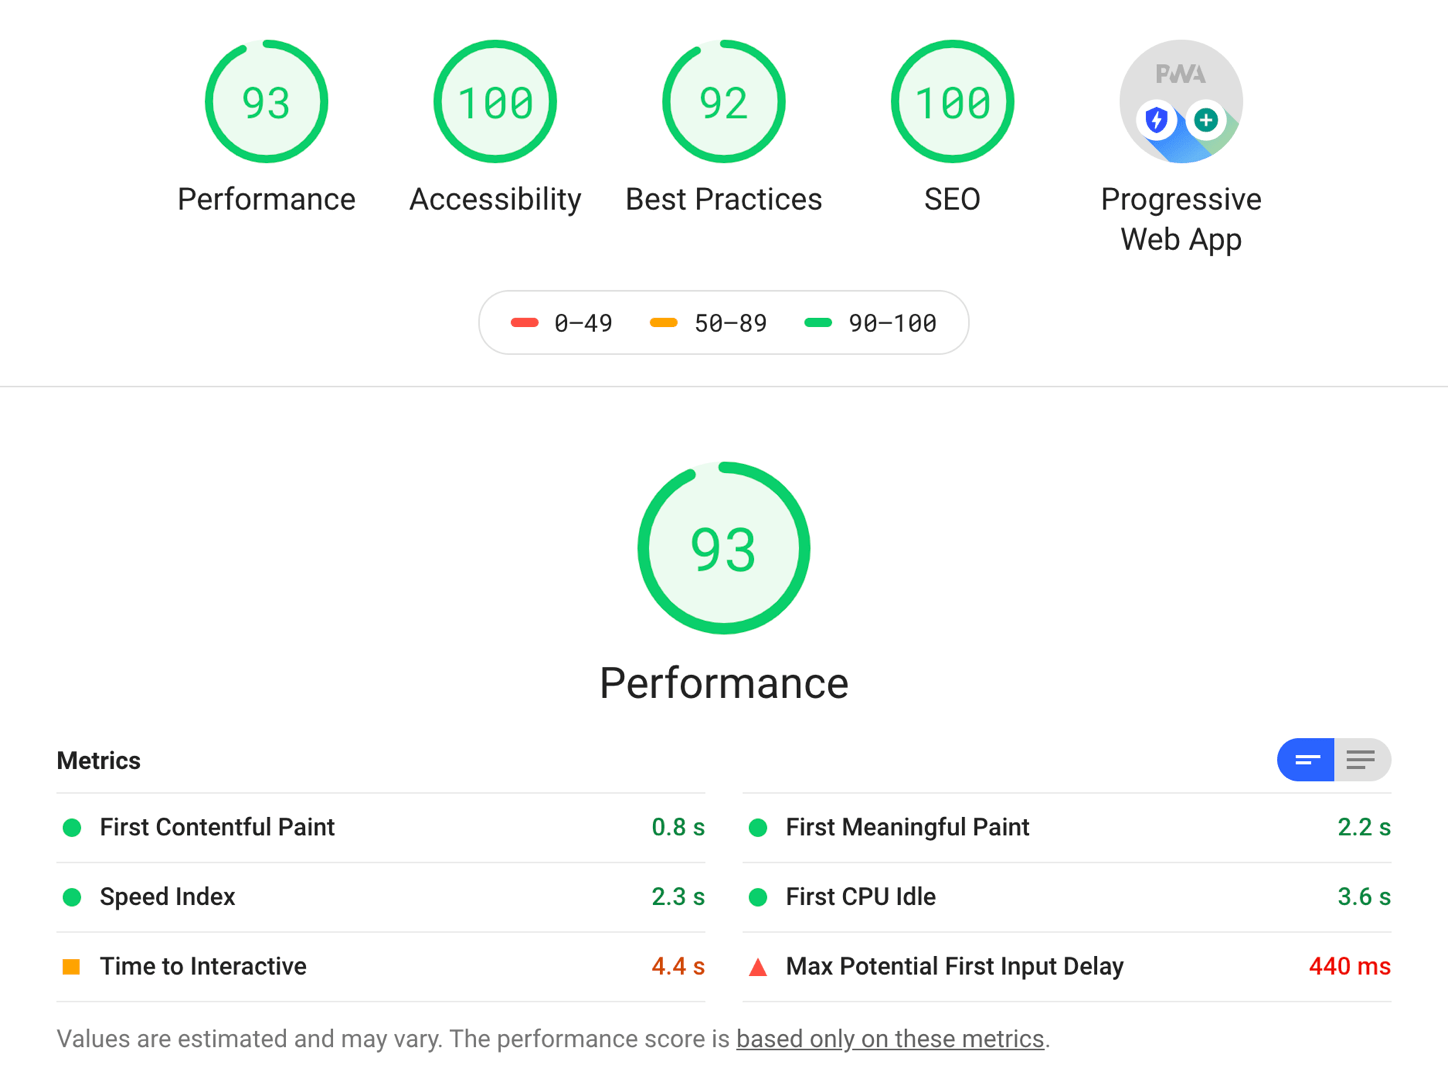 Example Lighthouse report.
4. Performance Score
The Lighthouse Performance score is a weighted average of all performance audits. It's a number between 0 and 100, where higher means a better score.
This score is determined by aggregating the following audits:
- First Contentful Paint
- Speed Index
- Largest Contentful Pain
- Time to Interactive
- Total Blocking Time
- Cumulative Layout Shift
You can read more on how Lighthouse weights these audits here.
5. Accessibility Score
The Lighthouse Performance score is a weighted average of all accessibility audits on your site. It's also a number between 0 and 100, where higher means a better score.
It aggregates a large number of accessibility audits including:
ariaattributes- Images with
alttext - Valid values for the
langattribute
To see the full list of accessibility audits, and how Lighthouse weights these audits, here is an article on the topic.
6. SEO Score
The Lighthouse SEO score tells you how well search engines can understand your content. It's a weighted average of all SEO audits on your site.
Again, it's a number between 0 and 100, where higher means a better score.
Some audits included in this score are:
- A valid
<title>element - A valid
robots.txtfile - A valid
rel=cannonicalattribute
There's plenty more audits that fall within the scope of this score. To read the full list, check out this article.
7. Best Practices Score
The Lighthouse Best Practices score tells you about the code health of your web page. As with all other scores, it also shows you opportunities to improve the health of your site.
It's a weighted average, in which 0 is the lowest score and 100 the highest (better), and includes various technical audits such as:
- Correct aspect ratio for images
- Using HTTP/2 for all resources
- Using HTTPS to serve the site
- Not using deprecated browser APIs
To read all audits included in this score, read this article by the Lighthouse team.
8. PWA Score
The Lighthouse PWA score tells you if your site is compatible with the requirements for a Progressive Web App. At a high level, that means it should be fast, reliable and installable.
It's a weighted average, in which 0 is the lowest score and 100 the highest (better), and includes various technical audits such as:
- Page load should be fast even on mobile networks
- Use HTTPS to serve the website
- Registers a service worker that controls page and
start_url - The web app manifest meets the installability requirements
You can find the rest of the audits for this score in this article.
Page Load Metrics
When you click a link, your web browser starts a multi-step process to load all synchronous resources required for this web page. The longer this process takes, the longer you must wait to interact with a website.
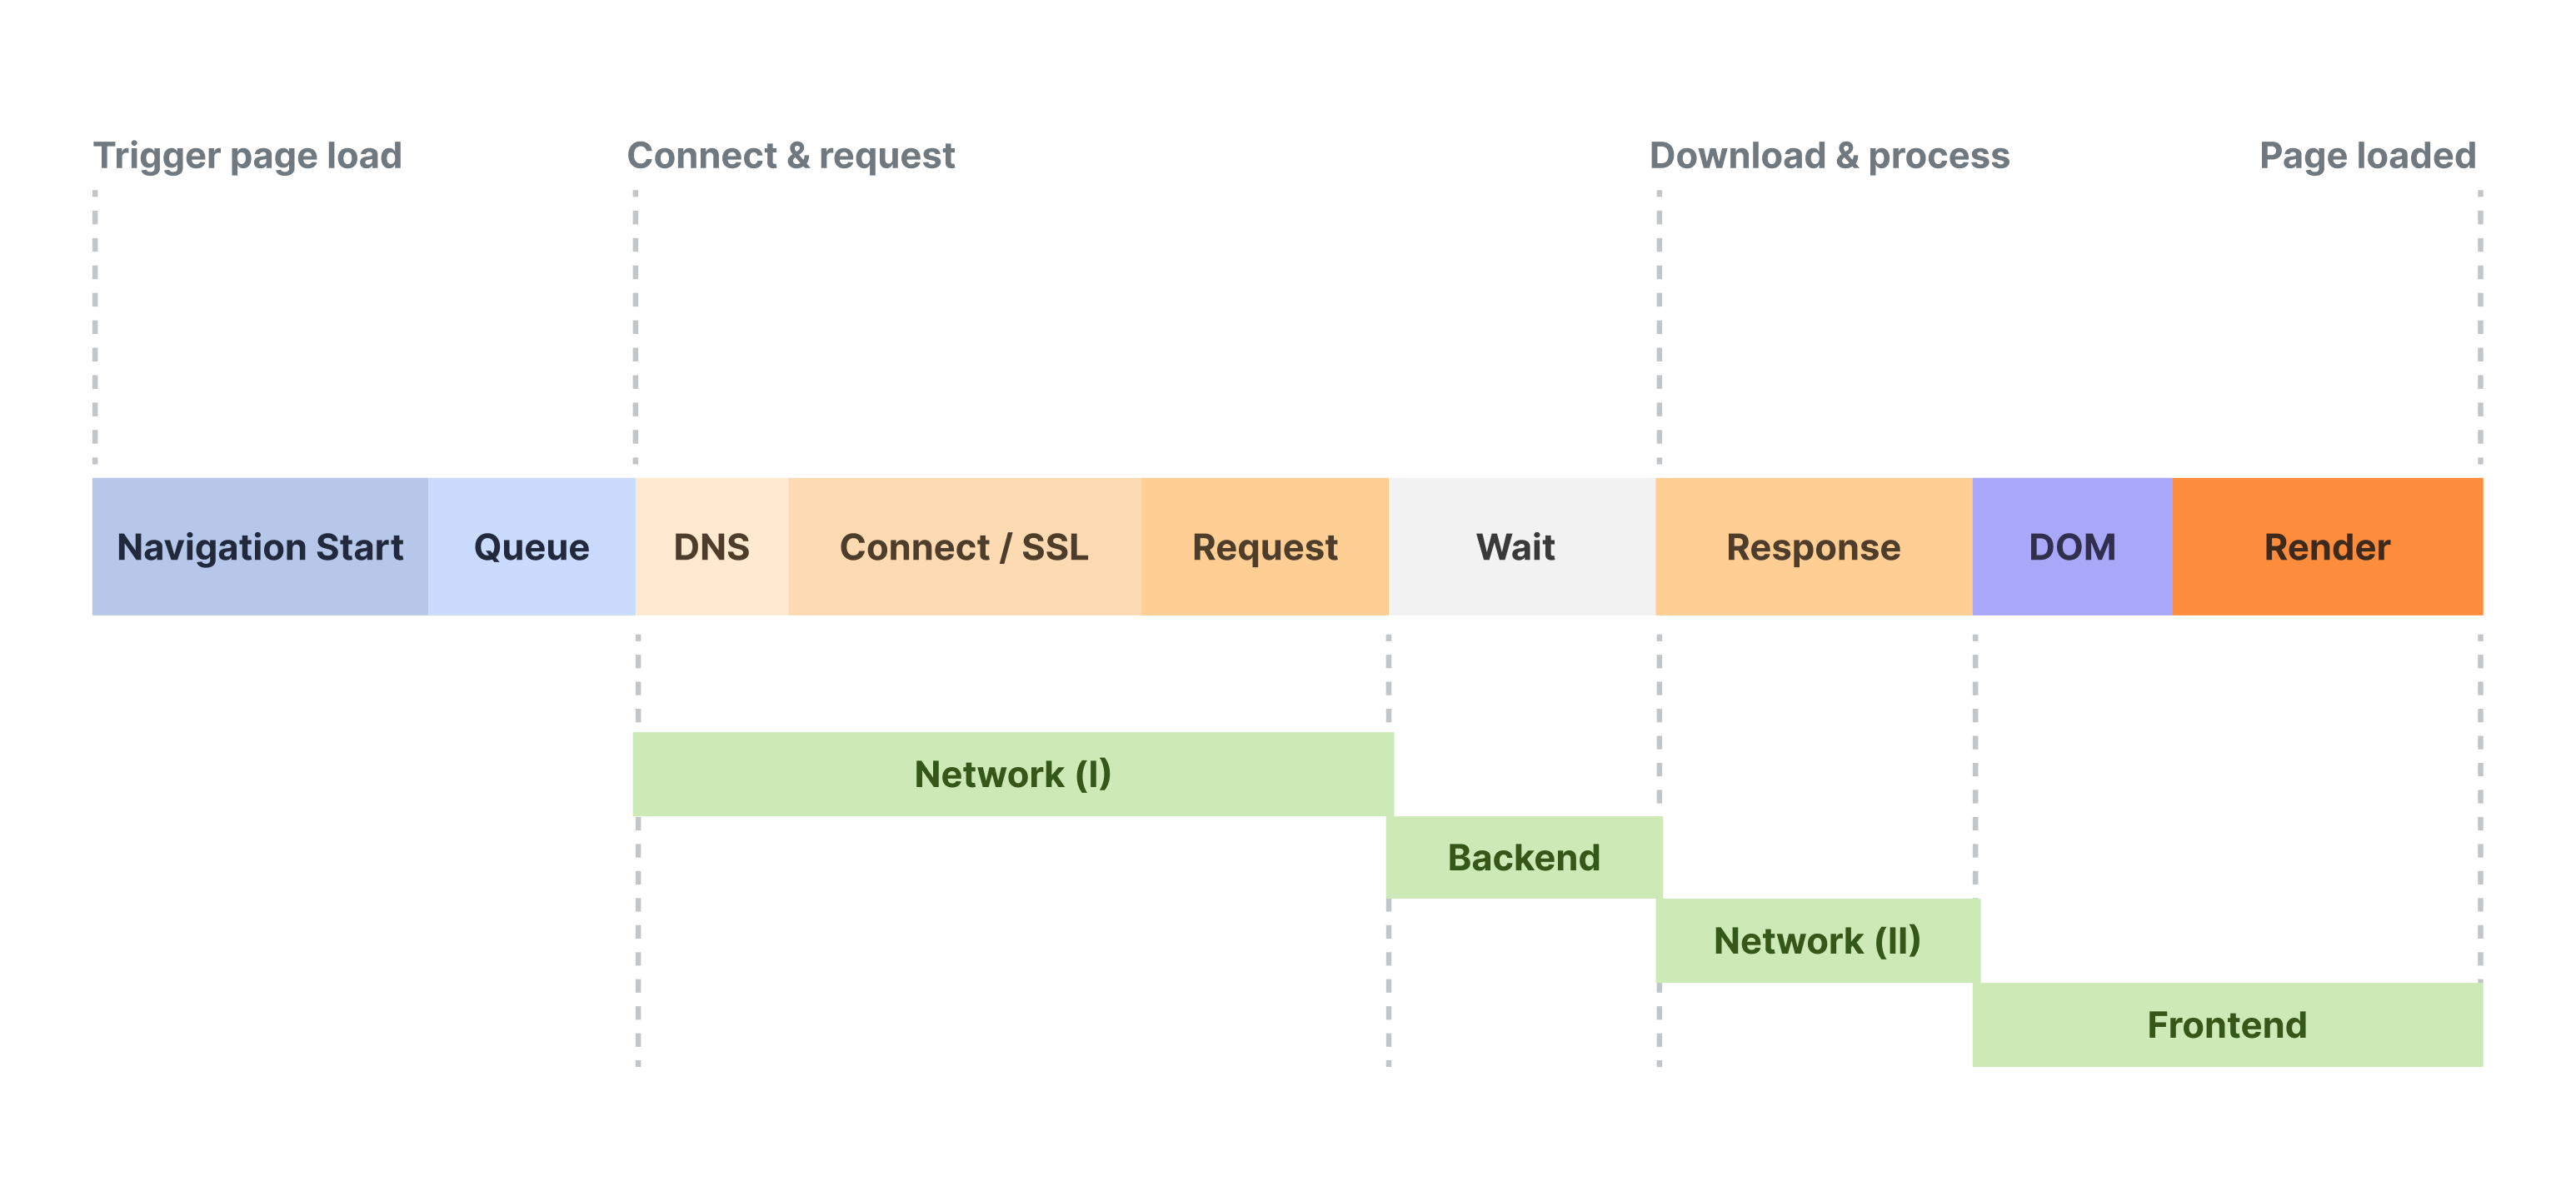 A simplified page load time process.
How long this process takes is what the Page Load Time measures. It involves multiple steps, and can be broken into multiple parts such as DNS lookup time, SSL/TLS, download size and many more.
Let's look into each one individually.
9. Page Load Time
Page load time measures the amount of time it takes for a complete web page to show up on your screen.
It's measured from the point a user initiates it - such as clicking on a link or typing the website URL - to when the page has fully loaded in the browser. For more details, see our guide on Page Load Time.
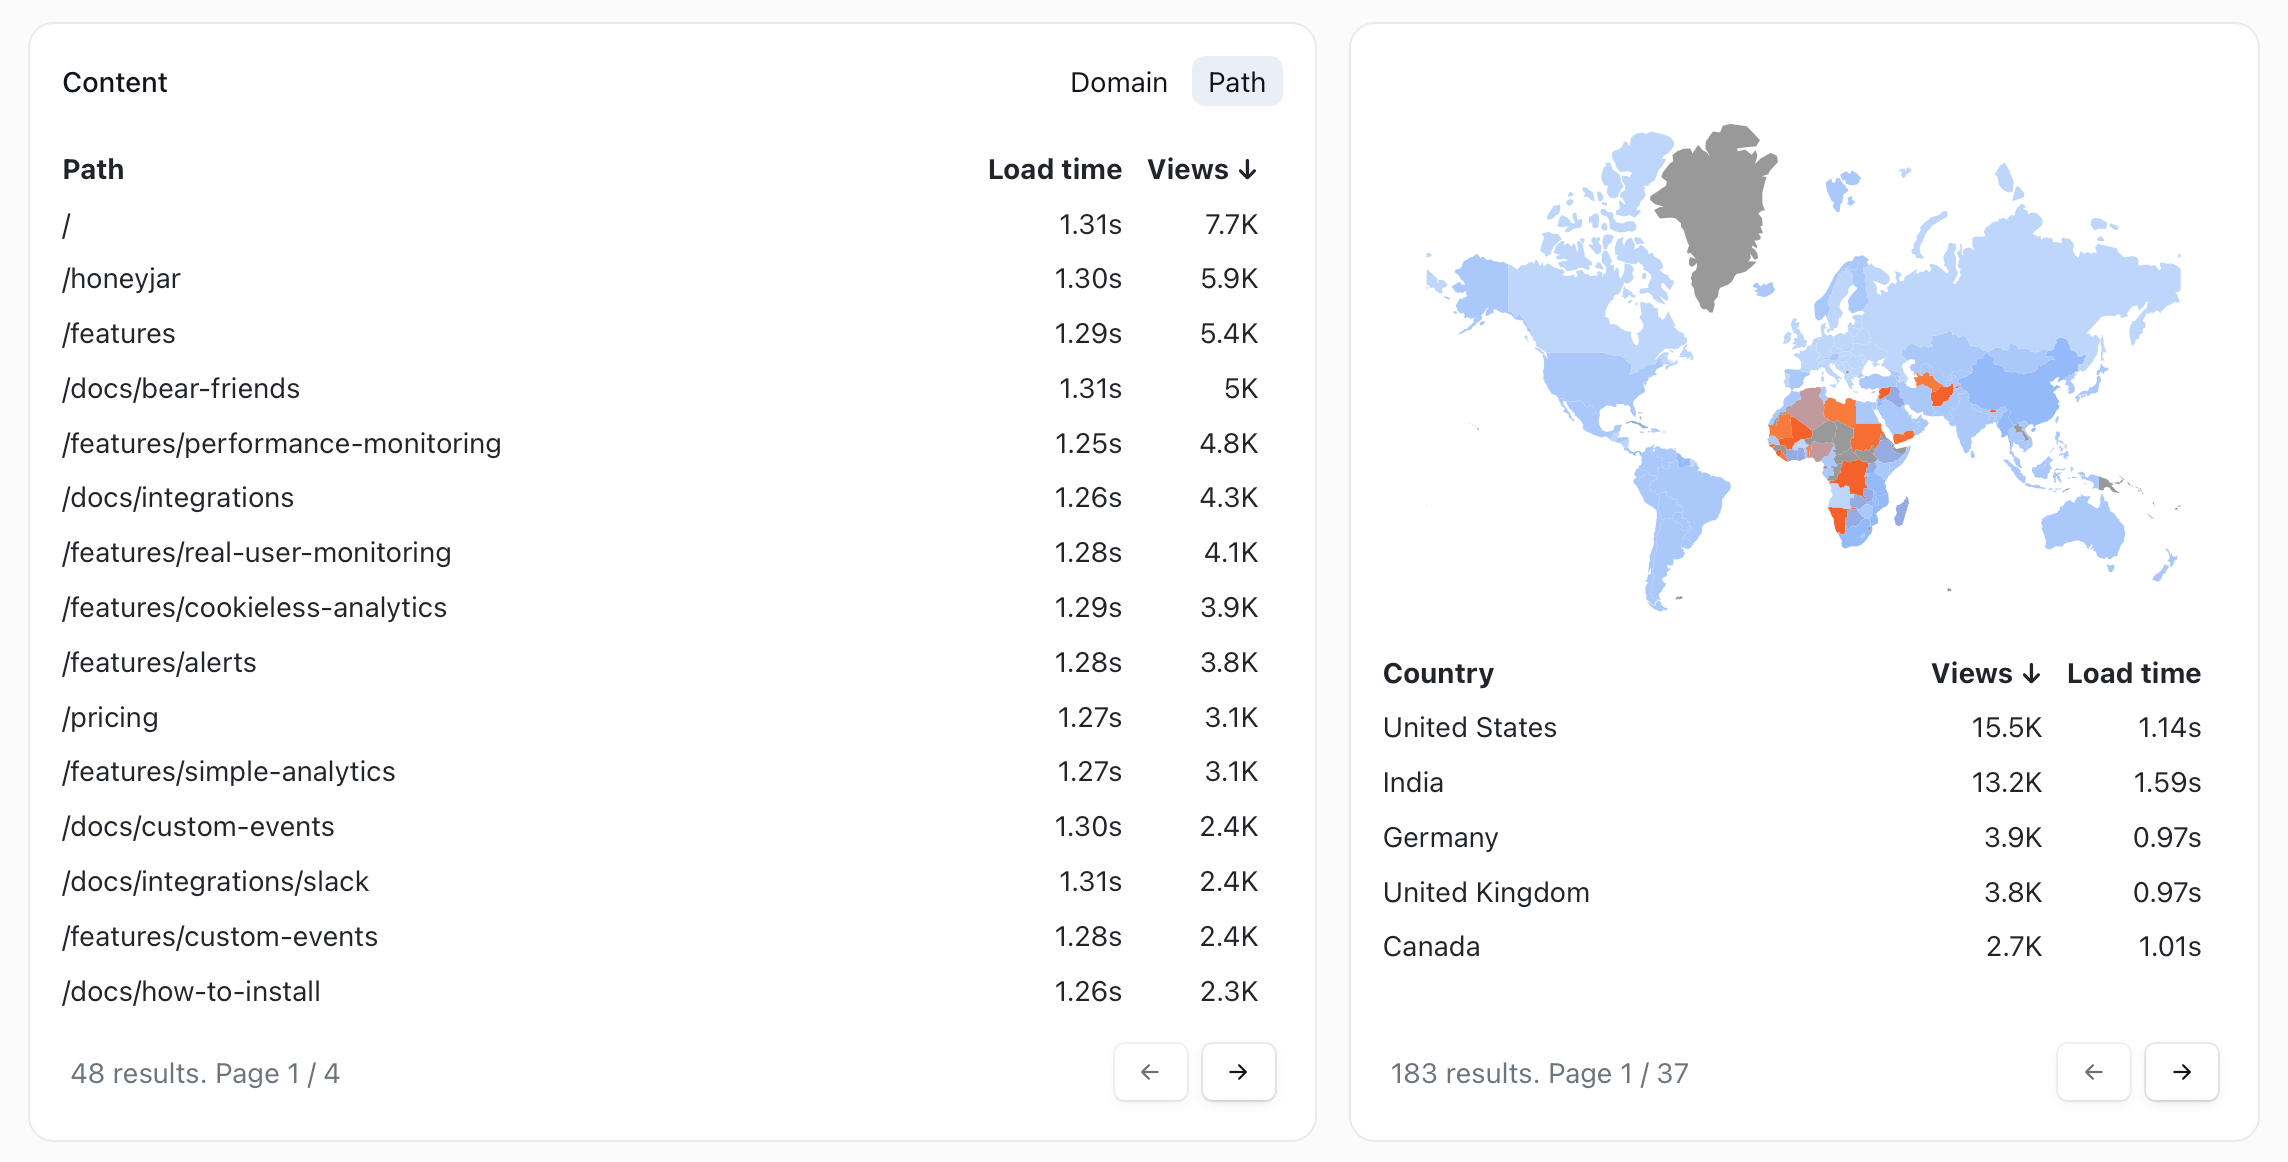 Various page load time measurements in Cronitor
10. Domain Lookup Time
The Domain Lookup Time is the time spent resolving the server address for a given domain.
For example, when you type google.com your browser must first resolve that domain name into an IP address (the server which will serve the page HTML for our request). The duration of this process is what this metric measures.
11. Server Connection Time
Once the browser has resolved the domain name into an IP address, it now needs to connect to the web server. The Server Connection Time measures how long it took to establish a TCP connection to the server.
12. Establish SSL/TLS Time
Transport Layer Security (TLS) is an encryption protocol designed to secure communications over the Internet.
Establish SSL/TLS Time measures how long it takes to perform a TLS handshake. During a TLS handshake, the two sides exchange messages to acknowledge and verify each other, establish which encryption algorithm will be used, and agree on session keys.
This process is a foundational part of how HTTPS works, and is vital to ensure privacy and security while you browse the web.
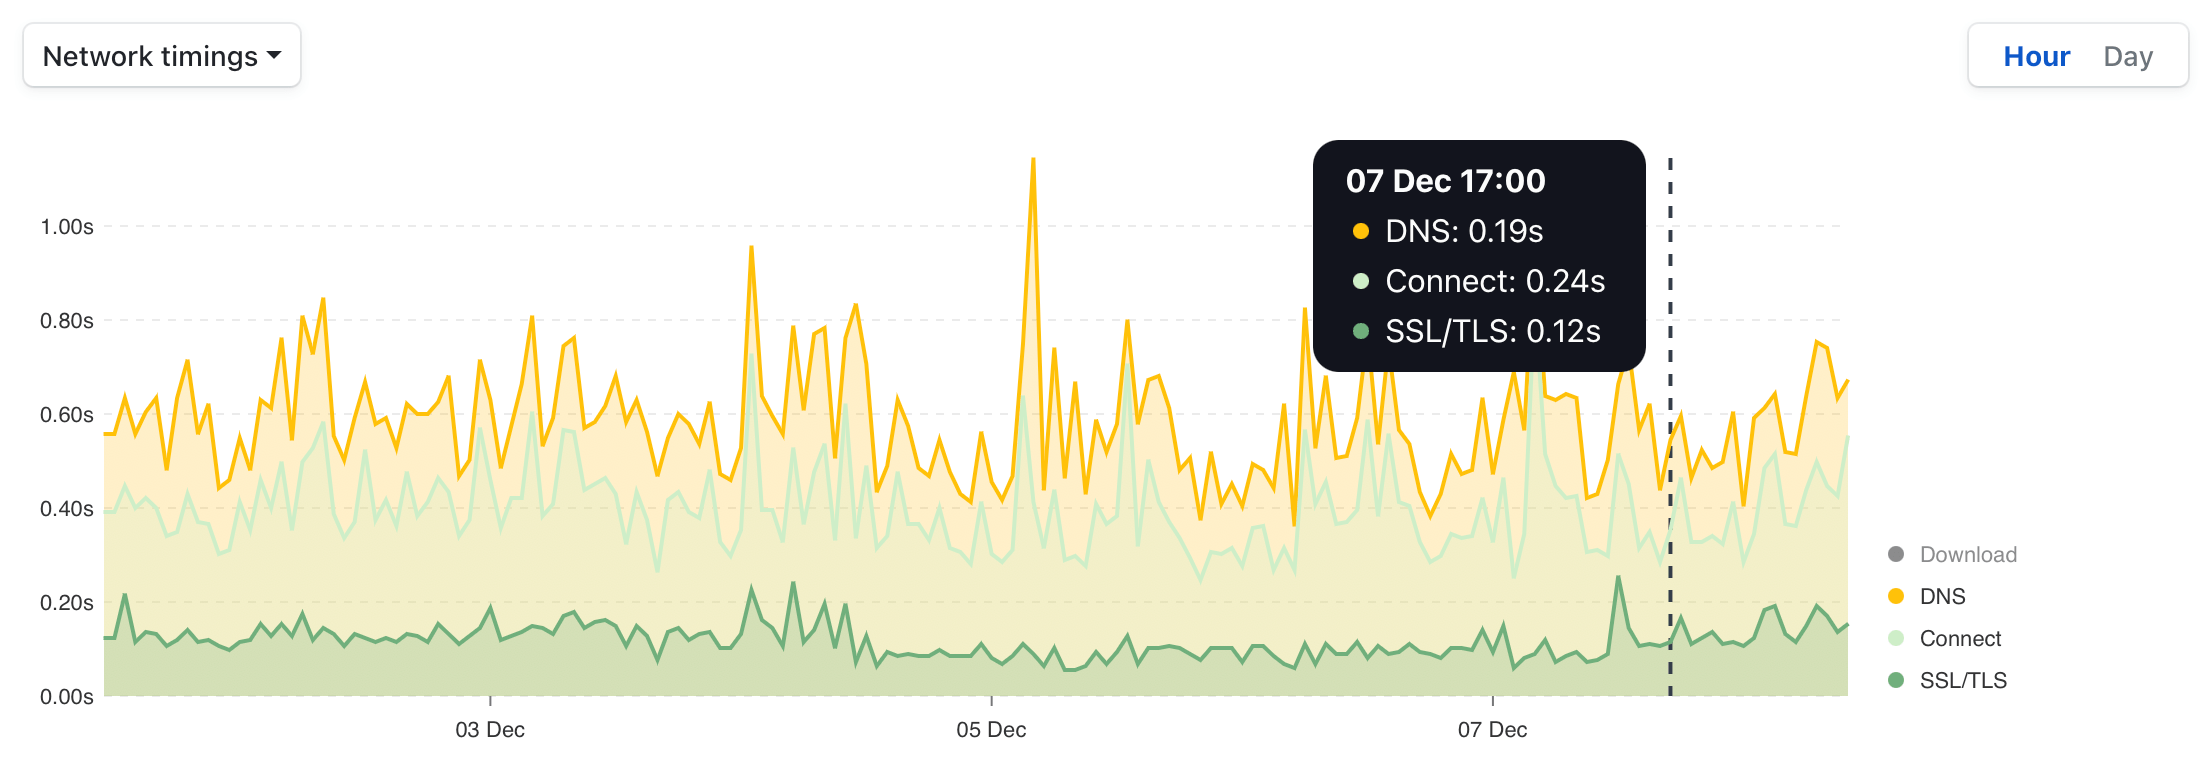 Various network timings in Cronitor.
13. Time to First Byte (TTFB)
Time to First Byte (TTFB) is how long it takes from when a browser requests a page to when it receives the first byte of information from the server. This usually includes the time spent on DNS lookup, establishing the TCP connection, and the SSL/TLS handshake if the request was made over HTTPS.
It's a good metric to approximate the performance of a backend server, from the perspective of the end user.
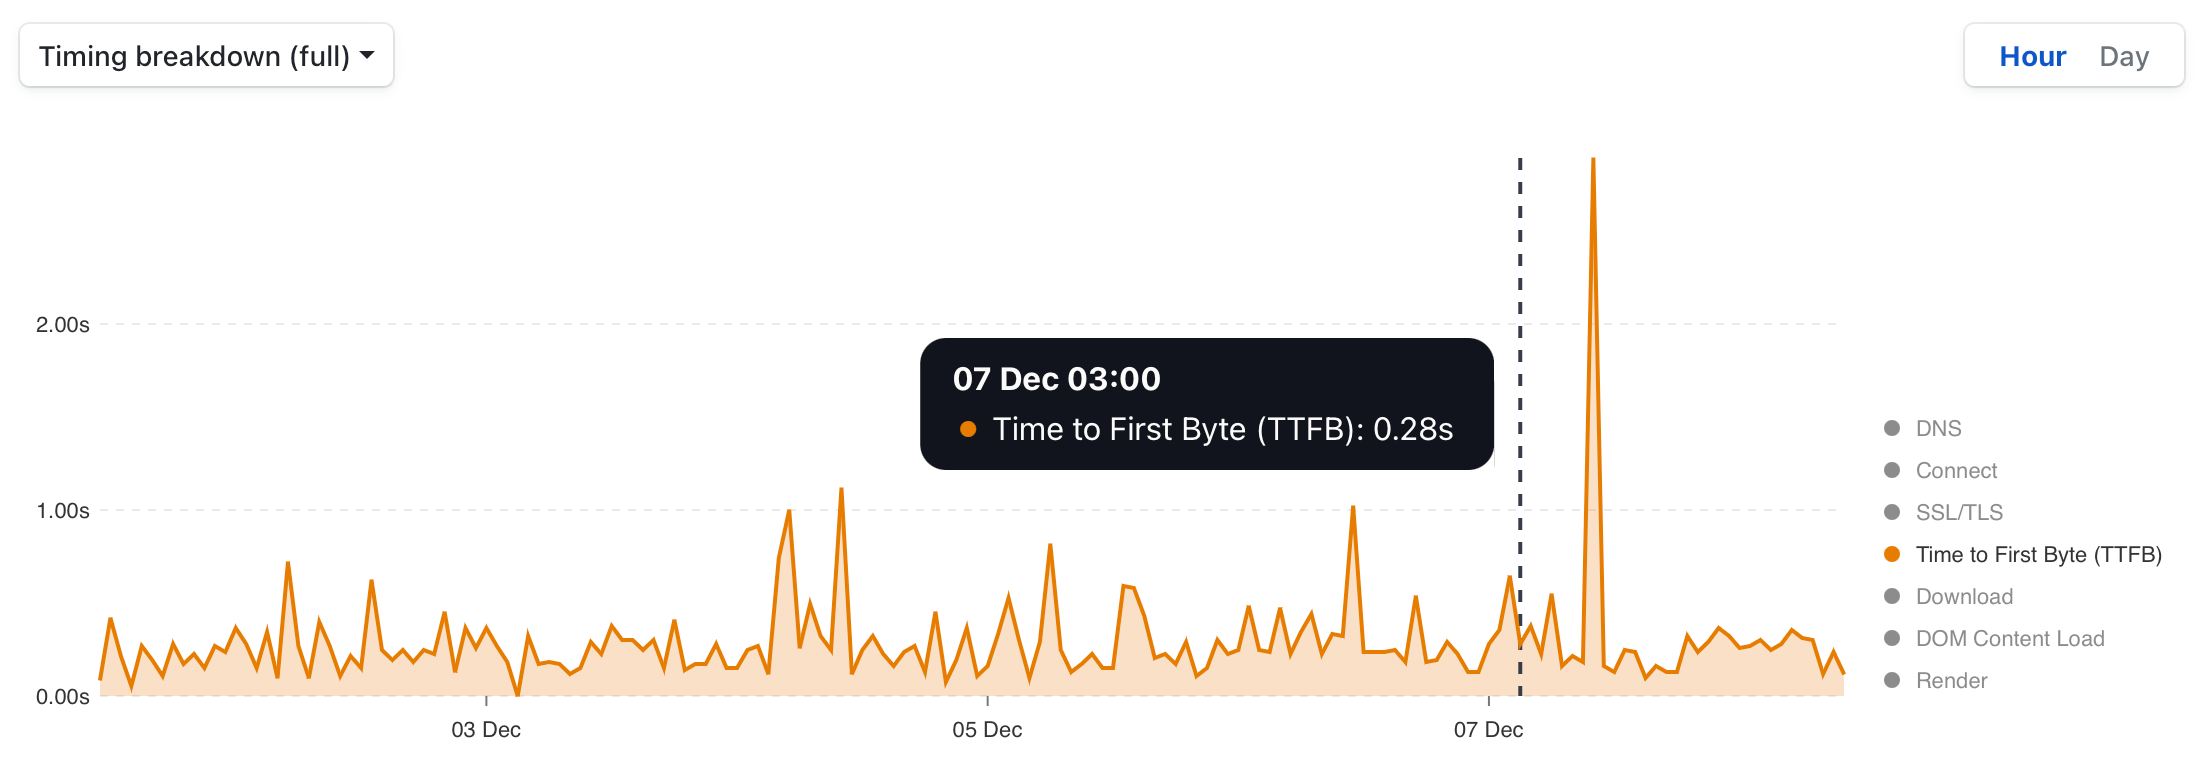 Inspecting the median TTFB for a website.
Why is this metric important?
If you measure the response time of your server from the server itself, you would only account for the time your server spent processing the request. In other words, the journey from your server to the user's browser would be unaccounted for.
For example, say you are located in California and your server is located in an AWS data center in North Virginia. You measure your TTFB and you're happy to see a result of 25 ms. However, when a user from the EU or Australia opens your website, the TTFB is now 200-500 ms.
The conclusion here might be that no matter if you scale your servers vertically or horizontally, the real issue is that the server is too far away from the end users. So you probably want to deploy servers in those regions too - assuming it makes sense for your product or business.
14. HTML Download Time
HTML Download Time measures the time it takes to download the initial document for a website. This document normally references various other resources (images, stylesheets, scripts) which are queued for download too.
15. Render Time
The Render Time measures how long it takes for the browser to paint the HTML document after downloading and parsing. This can vary a lot as it highly depends on the complexity of your site and the performance capabilities of the users device (eg. some mobile devices can take longer to render a complex website vs a powerful development machine).
16. Request Count
The Request Count refers to the number of resources required to load a web page. The impact of this metric on end user experience is highly dependent on other factors too.
For example, if you have a website which requires 50 requests to load but most of them are small resources which do not block rendering, it may not negatively impact how the user interacts with the site.
On the other hand, if you have a web page which requires a single request to load, but that request takes 10 seconds to complete and loads several megabytes of data, it's likely the user will abandon the site before the request completes.
As with most other metrics, it's useful to measure request count in relation to the other characteristics of your web page.
17. Transfer Size
Transfer Size measures the total size of all assets transferred during page load. This includes every request for HTML, images, stylesheets, scripts, and JSON documents.
It's a good measurement of how heavy your web page is.
18. HTML Transfer Size
The HTML Transfer Size tells you the size of all HTML assets transferred on page load.
19. Image Transfer Size
The Image Transfer Size tells you the size of all image assets transferred during page load.
The following are examples of common image assets:
| Format name | Extension | MIME type |
|---|---|---|
| Graphics Interchange Format (GIF) | .gif | image/gif |
| Web Picture format (WEBP) | .webp | image/webp |
| Portable Network Graphics (PNG) | .png | image/png |
| AV1 Image File Format (AVIF) | .avif | image/avif |
| Joint Photographic Expert Group image (JPEG) | .jpeg, .jpg | image/jpeg |
| Scalable Vector Graphics (SVG) | .svg | image/svg+xml |
20. CSS Transfer Size
CSS Transfer Size measures the total size of all stylesheet (CSS) assets transferred during page load.
21. Font Transfer Size
The Font Transfer Size tells you the size of all font assets transferred during page load.
The following are examples of font assets:
| Format name | Extension | MIME type |
|---|---|---|
| TrueType | .ttf | font/ttf |
| Web Open Font Format | .woff, .woff2 | font/woff, font/woff2 |
| OpenType | .otf | font/otf |
22. Javascript Transfer Size
The Javascript Transfer Size measures the total size of all Javascript (JS) assets transferred during page load.
For many modern web apps, this asset type has become a considerable chunk of the page load process. Large Javascript files may not only lead to longer download times, but also increase the time the browser needs to parse and render the site. This can negatively affect how long it takes for the site to become interactive too.
In order to improve load times, many applications now rely on techniques such as tree shaking (automatically remove unused code), asset bundling (package related assets together) and code splitting (split files and only load as required for specific pages). Some popular tools for these purposes are webpack and esbuild.
23. JSON Transfer Size
JSON Transfer Size measures the total size of all JSON assets transferred during page load.
24. Video Transfer Size
Video Transfer Size measures the total size of all video assets transferred during page load.
Here are some examples of common video assets:
| Format name | Extension | MIME type |
|---|---|---|
| WebM | .webm | video/webm |
| Ogg | .ogg | video/ogg |
| MPEG-4 | .mp4 | video/mp4 |
| iPhone Index | .m3u8 | application/x-mpegURL |
| iPhone Segment | .ts | video/MP2T |
| Flash | .flv | video/x-flv |
| 3GP Mobile | .3gp | video/3gpp |
| QuickTime | .mov | video/quicktime |
| A/V Interleave | .avi | video/x-msvideo |
| Windows Media | .wmv | video/x-ms-wmv |
25. Javascript Error Count
The Javascript Error Count tells you how many runtime errors the browser encountered while loading your web page.
While on its own it's not enough to troubleshoot and debug errors, it's very helpful to track this metric in aggregate to ensure no deployments or configuration changes cause unintended issues during runtime.
This metric is most useful when monitored in conjunction with error tracking software. That way, if the total error count goes beyond your tolerance threshold, your team would be able to troubleshoot the issue by inspecting the reported stack traces, and breadcrumbs to understand why the issue happened and fix it early.
Conclusion
A faster website not only helps deliver a great user experience but can also significantly boost your conversion rate and sales.
Monitoring your website's performance over time is more important than ever in order to prevent unintended consequences when deploying bug fixes, adding third party scripts and making improvements to the site.
That way you can make changes with confidence that you're not breaking stuff without realizing, and ensuring you always deliver a great experience on your website.