Web Performance Monitoring
Page Load Time Explained: What Is It And How To Optimize It
Delivering a fast and seamless website is essential for ensuring an excellent end-user experience. Amazon's famous study found that every 100 ms of added latency cost them 1% in sales. This is why numerous resources are available on the topic, and companies often invest significant resources in optimizing their websites.
Tools like Cronitor RUM help you understand your website's speed by measuring the performance of every page view. You can filter data by country or page to analyze it more thoroughly. In addition to measuring website traffic, you can also set up page speed alerts and get notified when your website is underperforming.
What is Page Load Time?
Page load time is the duration it takes for a web page to load and display all its content in the user's browser, from the initial request to the final rendering. A website's load time significantly affects user satisfaction, engagement, and conversion rates. A fast-loading website provides a seamless user experience, while a slow-loading site can lead to user frustration and, ultimately, users leaving the site.
However, it's important to understand that the page load time only measures the time it took to initially load a site - it doesn't measure requests that happen after the initial load (e.g., fetch requests or async scripts).
In other words, once the page has loaded and a visitor starts interacting with your page, no additional measurements are made as it's not considered part of the initial page load.
How does the browser load a web page?
When a user clicks on a link, the web browser starts a multi-step process to load all synchronous resources required to show the web page on the screen. This process is what's counted towards the page load time of a site.
The longer this process takes, the longer a visitor must wait to interact with the website.
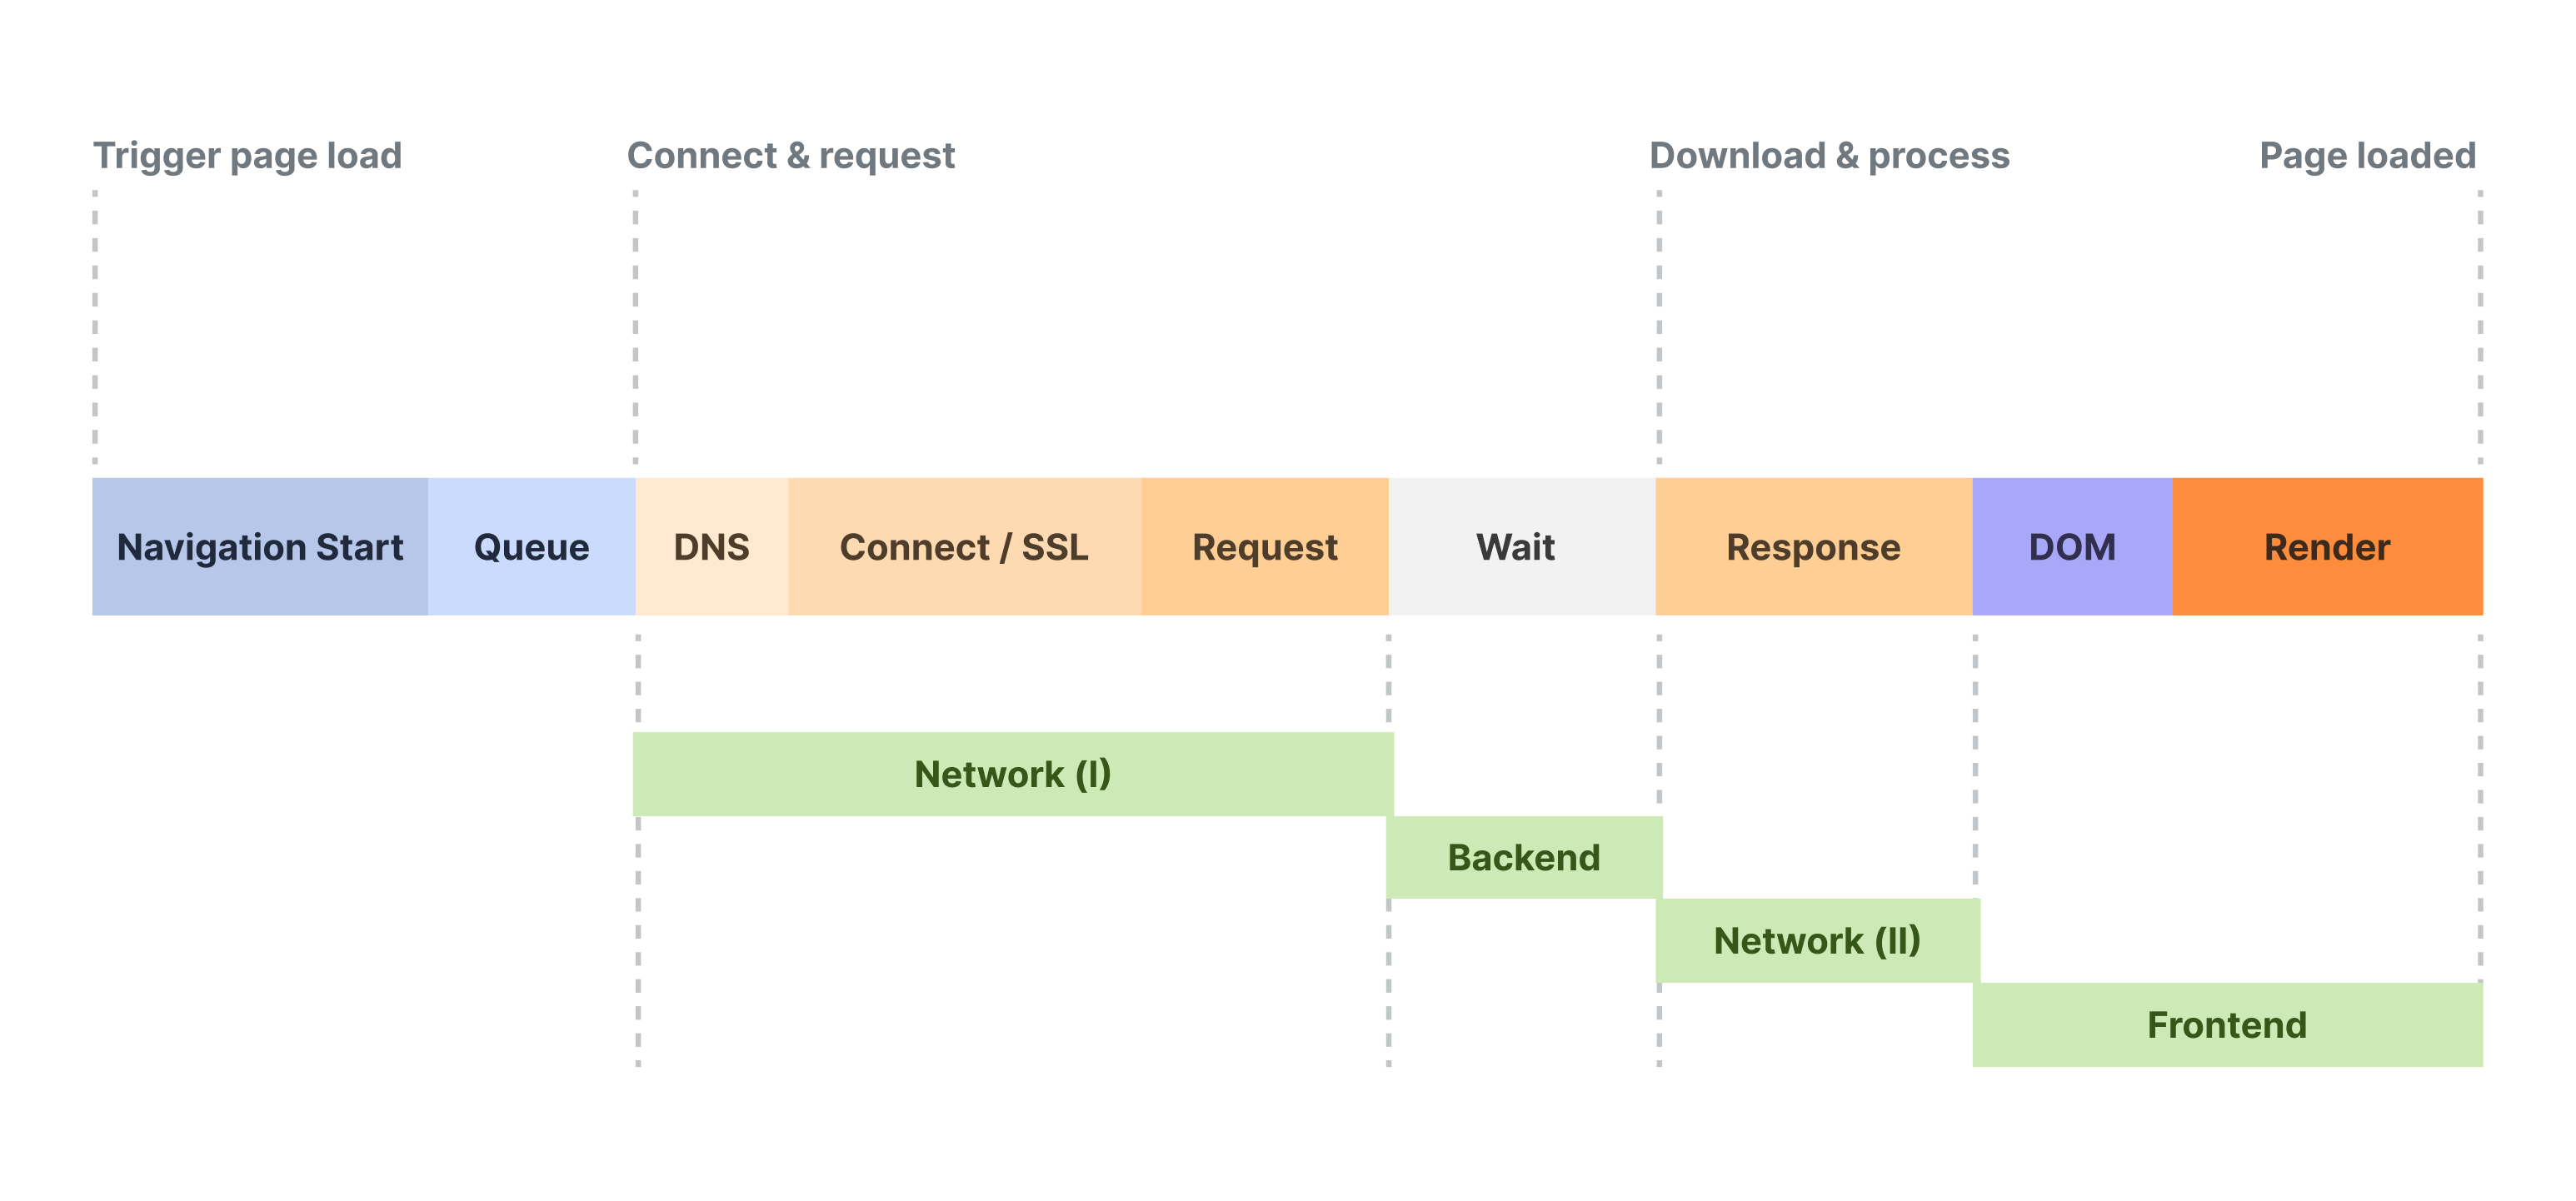
Here is a simplified view of what happens when someone opens your website:
The page load begins when a user initiates the navigation. For example when typing your website's URL in the browser or clicking on a link.
The browser queues the request, and tries to resolve the domain name for the URL. It then attempts to establish a secure connection to your server, and sends the request.
Your server processes the request. This step includes all server side logic (e.g. database queries, rendering the HTML), and your server begins sending the response back to the browser.
The browser parses the HTML, and renders the web page to the user. This initial HTML may initiate further resource requests, such as stylesheets, Javascript files, images, etc.
Once all synchronous resources have been loaded and rendered into the browser window, a page load event is fired, marking the completion on the web page load for your visitor.
Averages vs percentiles
Your page load time, as well as other performance metrics, are usually presented as averages and percentiles (eg. p50, p75, p95, p99).
Page Load Average: This is the average page load time. It's usually a good enough metric to quickly tell you how fast or slow your overall performance is. However, averages can be misleading because they "hide" outliers - they are far from the full picture - and that's why we also include percentiles as explained below.
50th Percentile (p50): It indicates that 50% of the page views are accounted for in the value shown. For example a p50 of 2 seconds means that half the users experienced a load time longer than 2 seconds.
75th Percentile (p75): It indicates that 75% of the page views are accounted for in the value shown. For example a p75 of 3 seconds means that 75% of the users had a load time of 3 seconds or less (or 25% of the users experienced a load time longer than 3 seconds).
95th Percentile (p95): It indicates that 95% of the page views are accounted for in the value shown. For example a p95 of 5 seconds means that 95% of the users had a load time of 5 seconds or less (only 5% of the users experienced a load time longer than 5 seconds).
Browser timings: network, backend and frontend
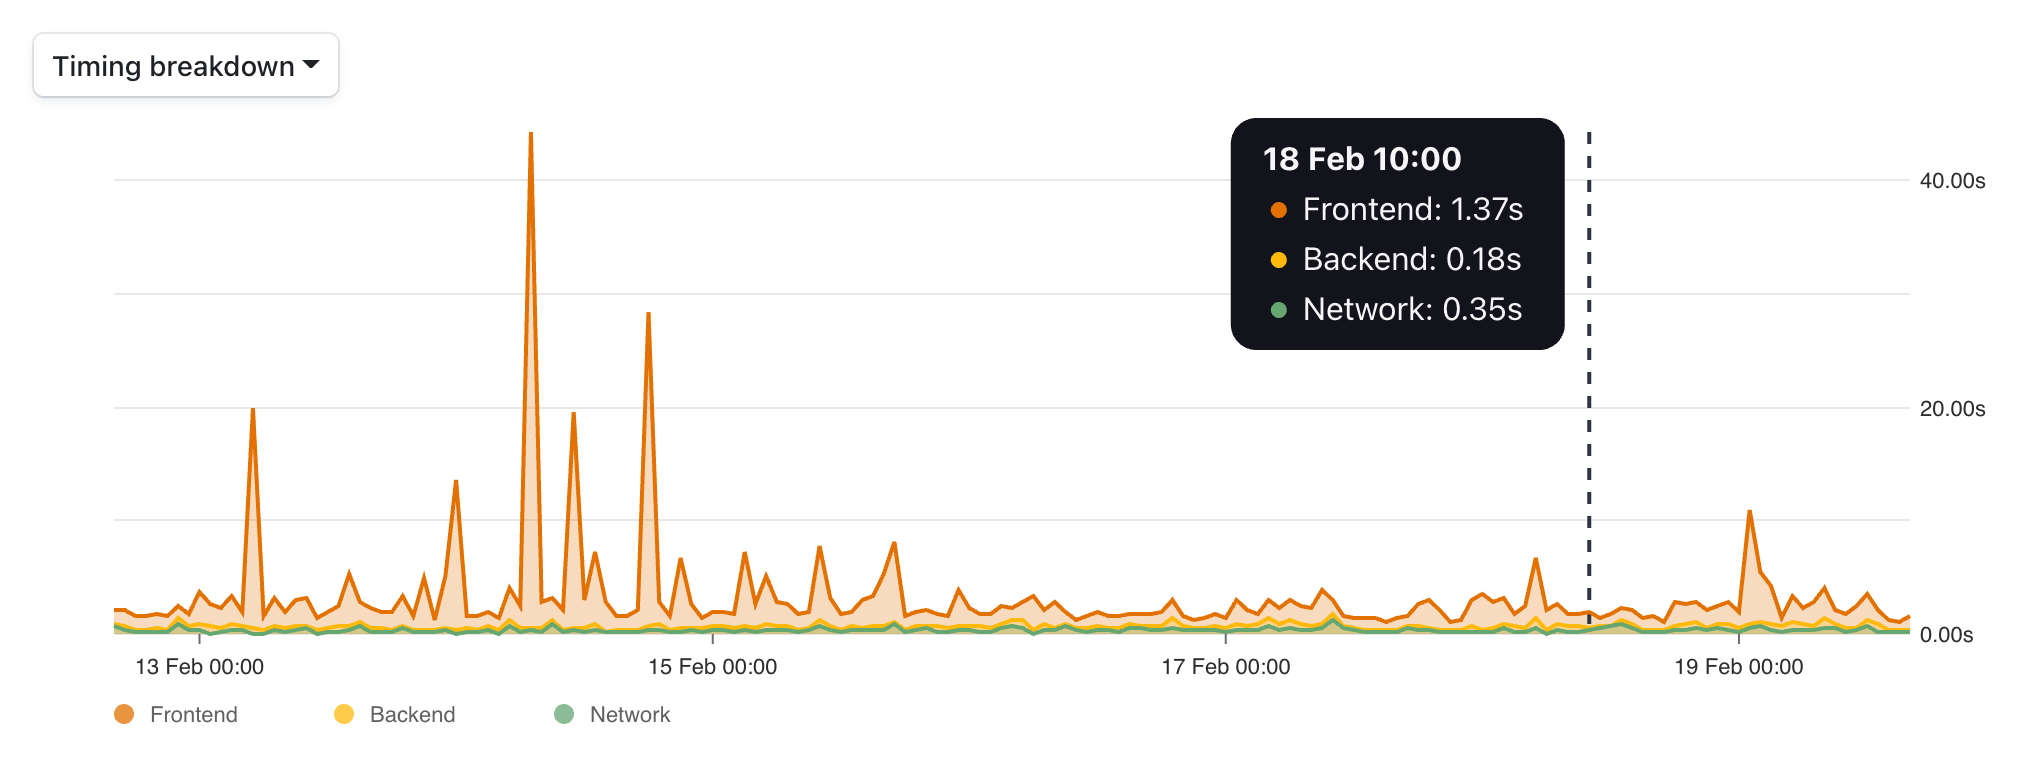
In tools like Cronitor RUM, you can also aggregate the page load time by stage. This helps you to understand where most of the time is spent during the page load process.
Backend: An approximation for the time your backend server took processing the request, and preparing the response. We use the time to first byte (TTFB) as a proxy for your server response time.
This corresponds to the time it took from sending the request, to when the first byte of the response arrived back from the server.
Network: Time spent on network related phases. These can vary greatly based on the connection speed that a visitor has, the type of connection (e.g. cable, 3G, 4G, 5G), etc.
The network phase includes the following steps:
- DNS lookup
- Establishing connection to server
- Downloading response from the server
Frontend: This metric tells you how much time was spent on parsing the server response, preparing the page resources and rendering them to the visitor's browser.
For example, the DOM processing and rendering stages are counted as part of the time spent on the frontend.
How to speed up page load time
In case you're looking to further improve your site's speed and end user experience, you should look into keeping your page load time to a minimum.
Here's some general recommendations to help you speed up your website:
- Compress your resources using gzip or Brotli if available on your web server.
- Bundle static assets using tools like Webpack, to reduce the number of HTTP requests.
- Set cache headers whenever possible to avoid unnecessary HTTP requests between page loads.
- Consider using a CDN to cache static assets at the edge.
- Use
deferorasyncfor non-essential HTML script tags (eg. analytics). This avoids blocking render during the initial page load.
Additionally, you might want to check out our introduction to Core Web Vitals - a new set of standards proposed by Google which paint a more complete picture about the end user performance. After all, page load time is just one of many factors that affect your site's end user experience.
Conclusion
Optimizing page load time is a critical aspect of delivering a satisfying user experience. As a developer, it's essential to be aware of the various factors that impact load time and utilize best practices to improve your website's performance.
By leveraging tools like Cronitor RUM, you can gain valuable insights into your website's speed and take informed decisions to enhance its performance.
Remember, a fast website not only keeps users engaged but also contributes to better search engine rankings and higher conversion rates. Continuously monitoring and optimizing your website's performance metrics will ensure that you deliver a seamless experience to your users even as you deploy changes over time.