Uptime Monitoring
Monitoring Private Endpoints and APIs
Uptime monitoring services usually make requests to your endpoints from different locations around the world. This works great until you need to monitor an endpoint that is only accessible within a private network.
Ideally you don’t want to open ports to the public internet or open a tunnel to your private network. That’s why we’ve put together this guide with a simple approach that keeps you in control of what’s deployed within your infrastructure.
What we’re building
The idea is this: monitor your internal HTTP services without exposing your private network, you can create a simple cron job which pings your internal services every N minutes. When the job fails or does not run on schedule, you'd get an alert and know something's up.
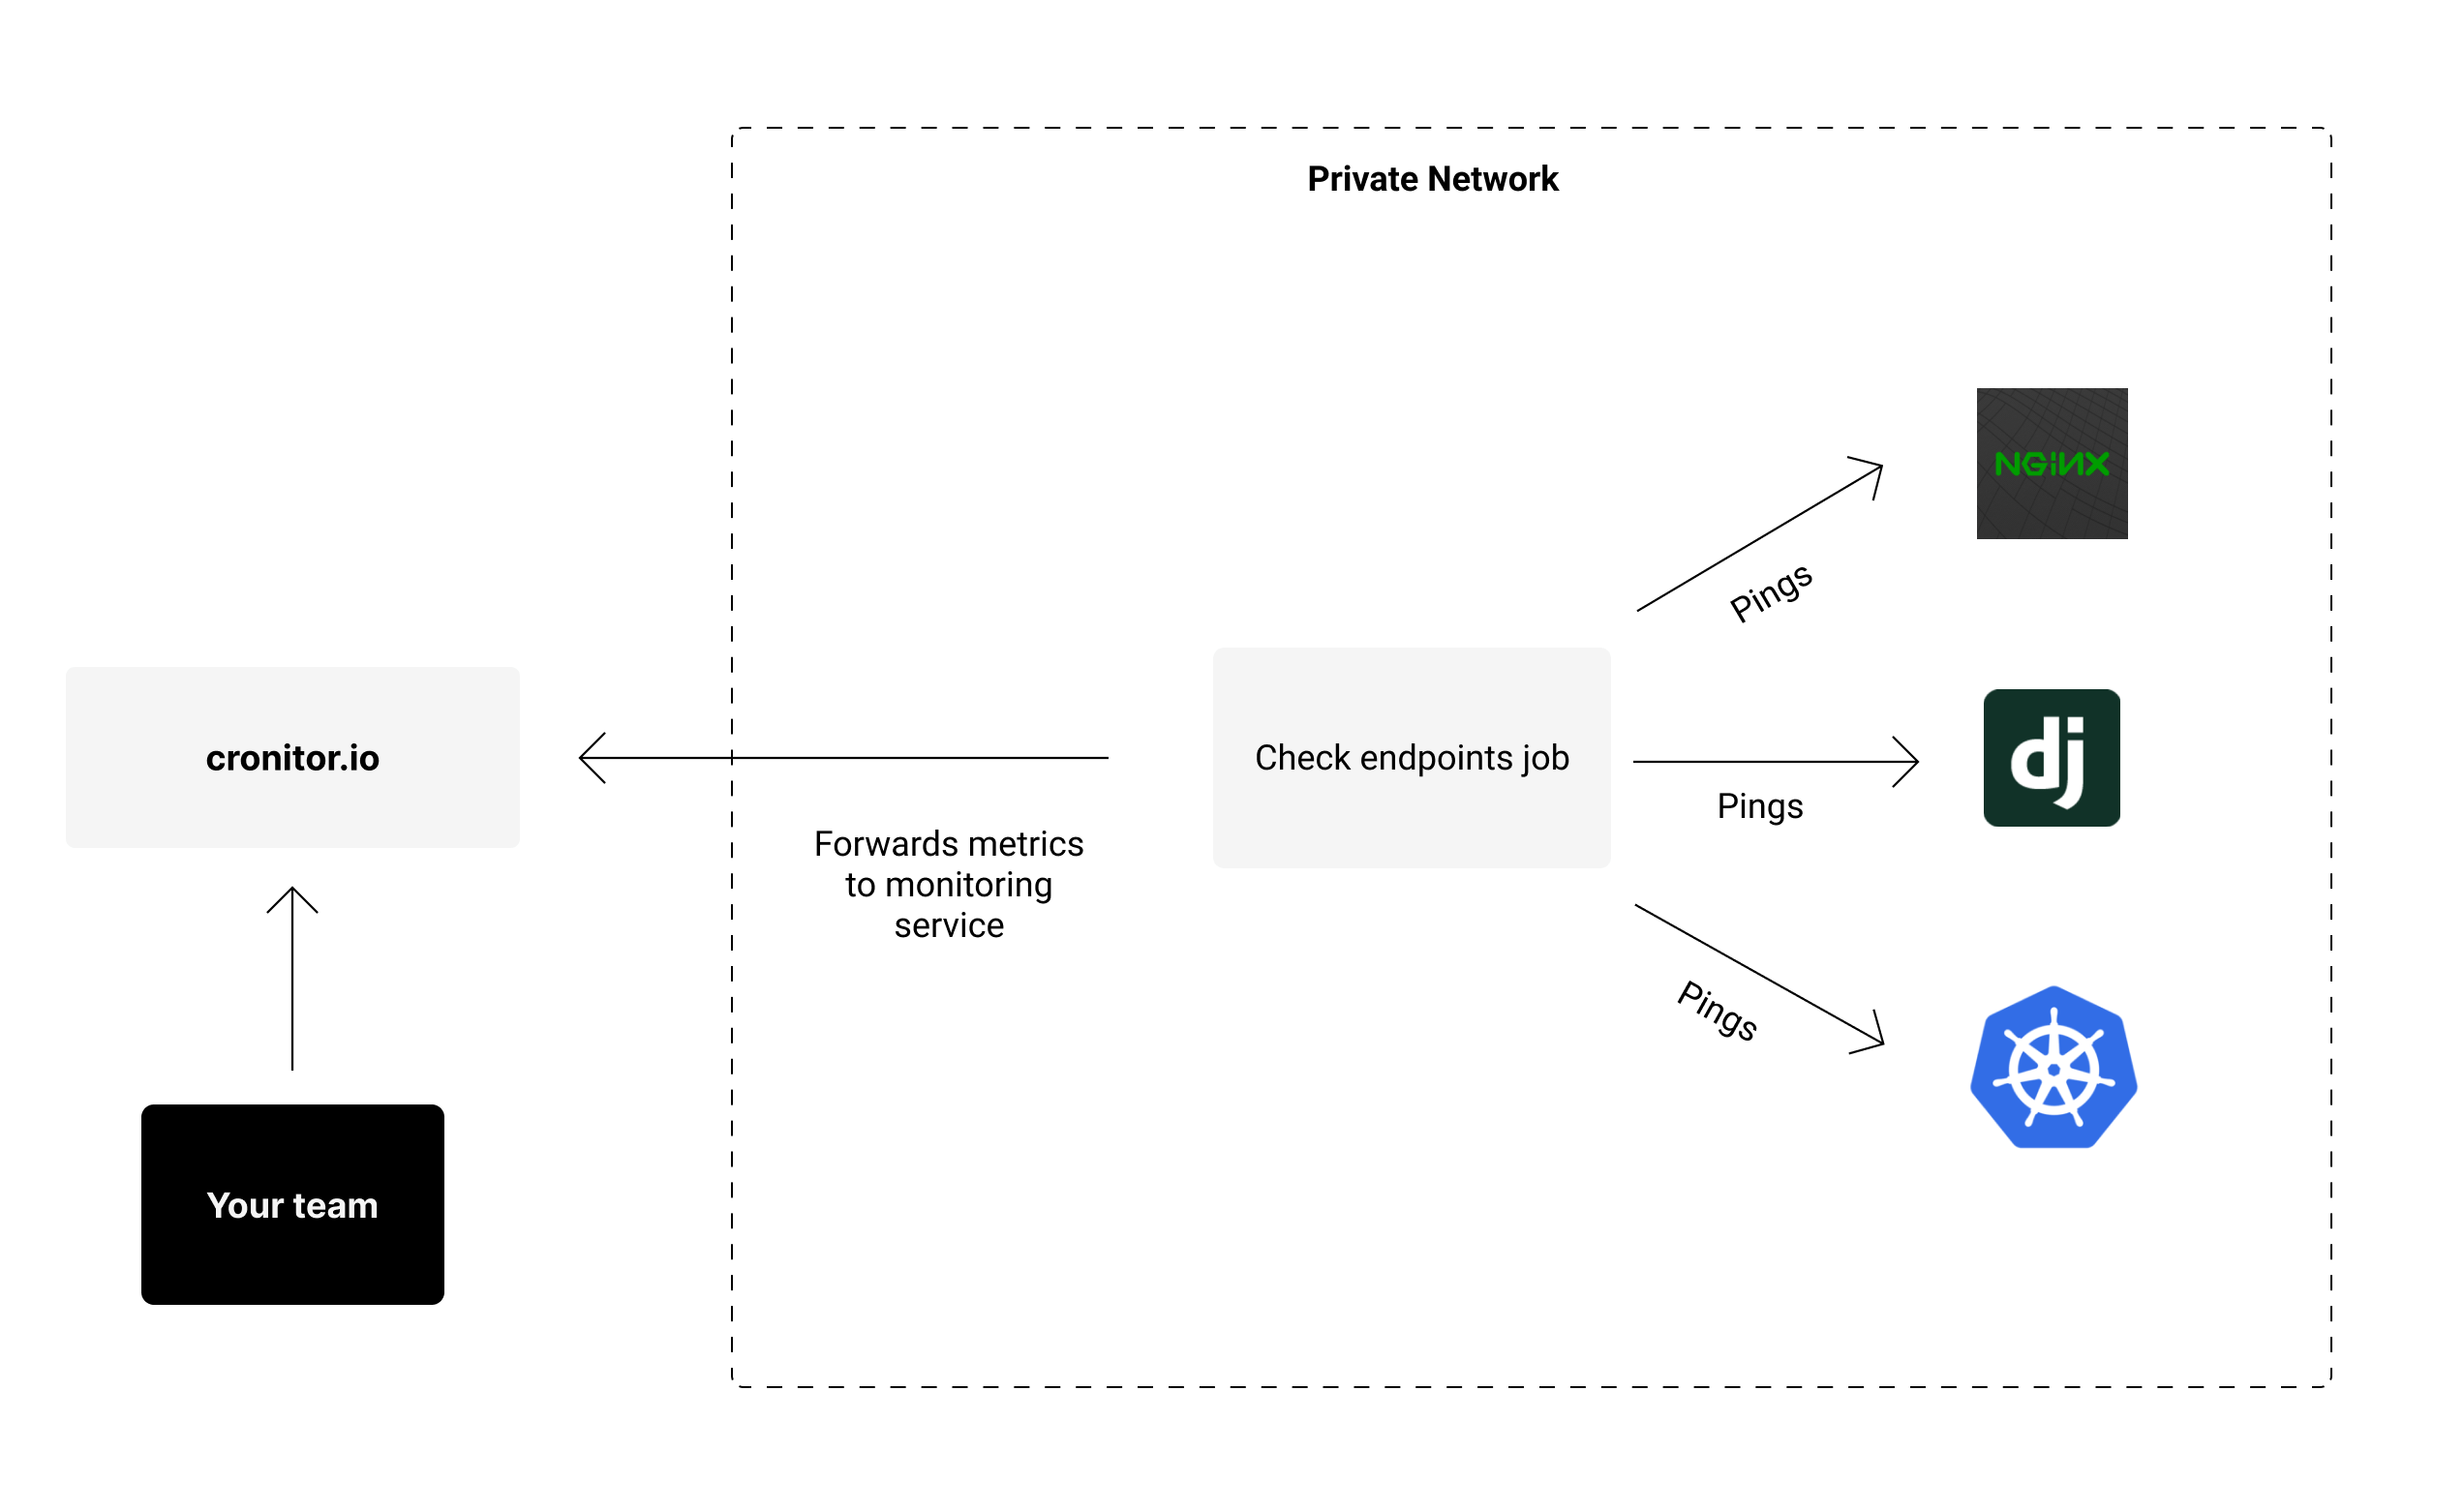
For this we’ll need:
- A bash script to perform the desired checks.
- One cron job entry for each endpoint you’d like to monitor.
- Your choice of monitoring platform, such as Cronitor, which we’ll be using in this guide.
You need a server within your private network on which to schedule this cron job. It could be any existing server that’s suitable for running cron jobs. That way, internal services are only visible to it, and you’re in full control of the resources within your private network.
Bash script for checking uptime
First, create the following bash script which will issue the HTTP requests to any given endpoint. You can save it anywhere on the server, for example in /opt/check_url.sh.
#!/usr/bin/env bash

if [ -z "$1" ]
  then echo "Usage: check.sh <URL>" && exit 1
fi

# Automatically exit script on any error
set -e

# Ping the desired URL, fail if not 2xx
curl --fail $1

echo "OK"
Grant execution rights to the script:
chmod +x /opt/check_url.sh
You can test the script by providing any URL as the first param:
/opt/check_url.sh https://cronitor.io
> OK
Register cron job schedule
Next, register a cron job to run every minute against every URL you’d like to monitor.
$ crontab -e

# Example uptime check entries
* * * * * /opt/check_url.sh https://example.com/internal-api
* * * * * /opt/check_url.sh https://example.com/other-internal-api
Type :wq! and hit return to save your new cron configuration and exit the editor. The checks should run every minute.
While this will already perform the checks for you, it won’t report any metrics or alert you in case there’s an issue. That’s where Cronitor comes in.
Cronitor will monitor each individual uptime check. When the bash script exits with an error code, Cronitor detects the failure and sends out an alert to your team via Slack, email, SMS and any other integration you configure.
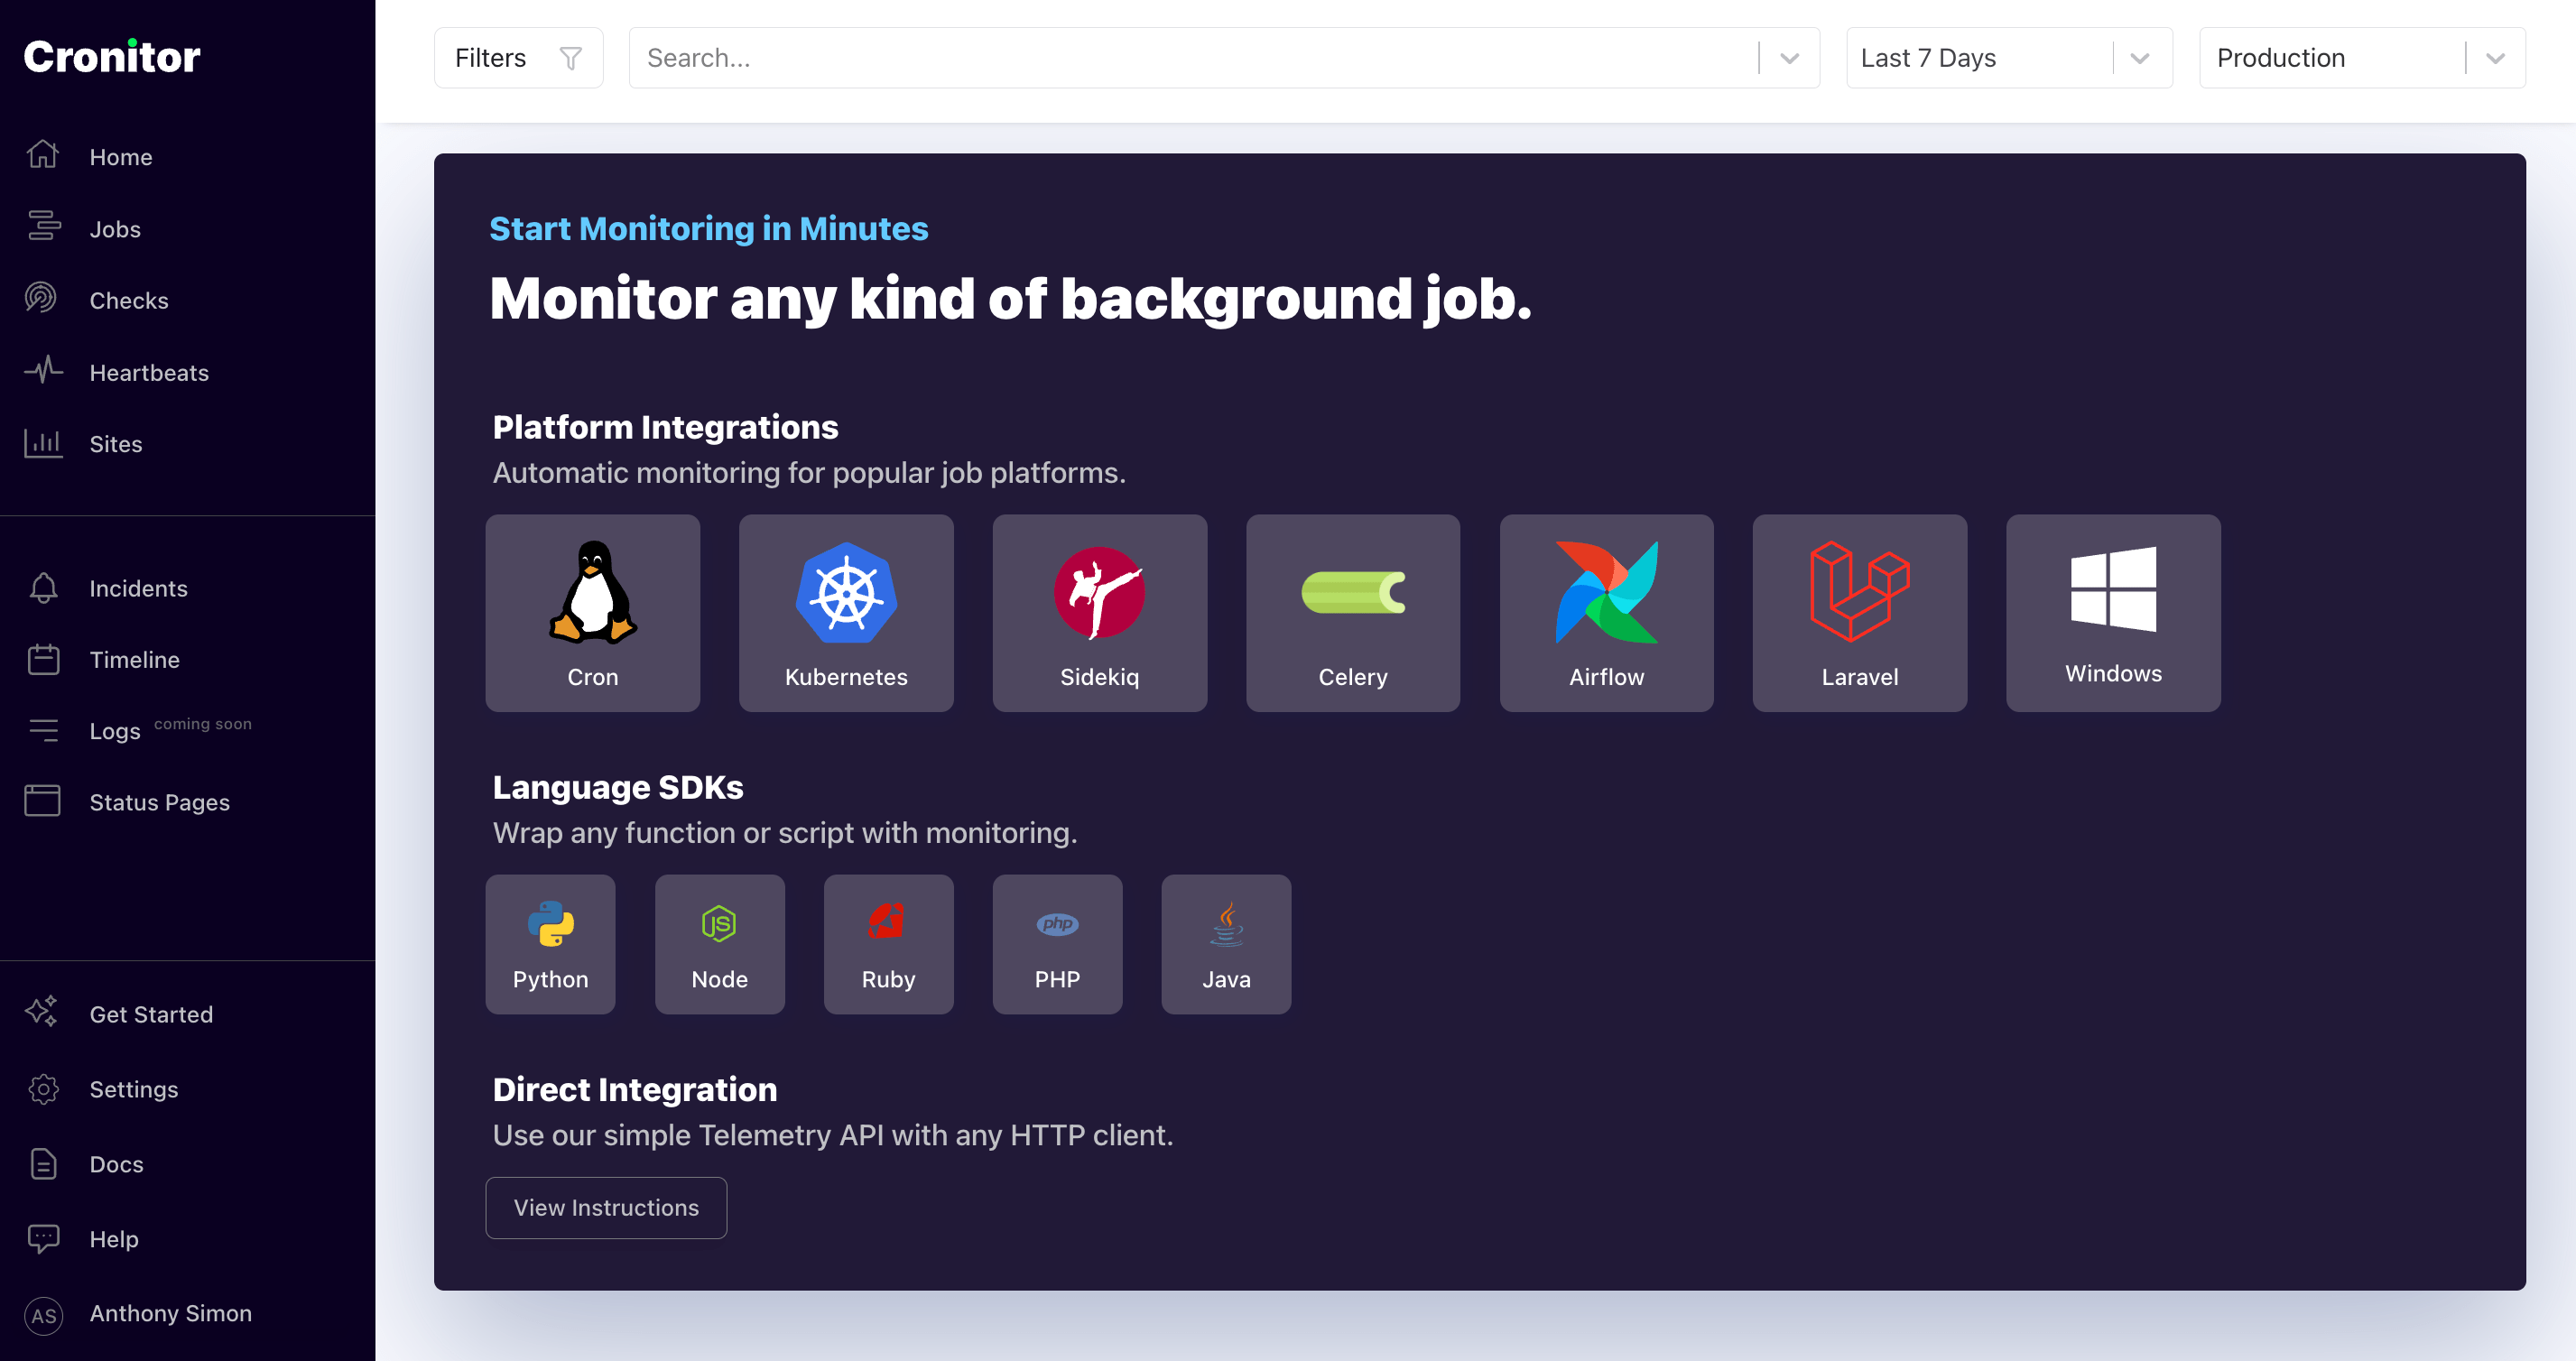
The free tier includes up to 5 monitors, so you can sign up at no cost and follow along.
Set up alerts
Once you have signed up for Cronitor, adding your cron jobs is easy. You can use the official CLI tool to forward job metrics for every uptime check.
The following snippet automatically installs the correct binary for your OS and architecture:
curl https://cronitor.io/install-linux?sudo=1 -H "API-KEY: REPLACE_ME" | sh
Don’t forget to use the API key provided in your dashboard.
Next run sudo cronitor discover to automatically find and monitor any cron jobs present in your server:
$ sudo cronitor discover

----► Scanning for cron jobs... (Use Ctrl-C to skip)
----► Checking user "ubuntu" crontab
 |--► Found 2 cron jobs:

* * * * * /opt/check_url.sh https://example.com/internal-api
     ✔ Job name: Check Internal API v1

* * * * * /opt/check_url.sh https://example.com/other-internal-api
     ✔ Job name: Check Internal API v2

----► Discover complete ✔
Back in your Cronitor dashboard, you’ll see that every monitor has been configured for you and is now being monitored. Whenever the uptime checks run, various metrics are collected for you in real time.
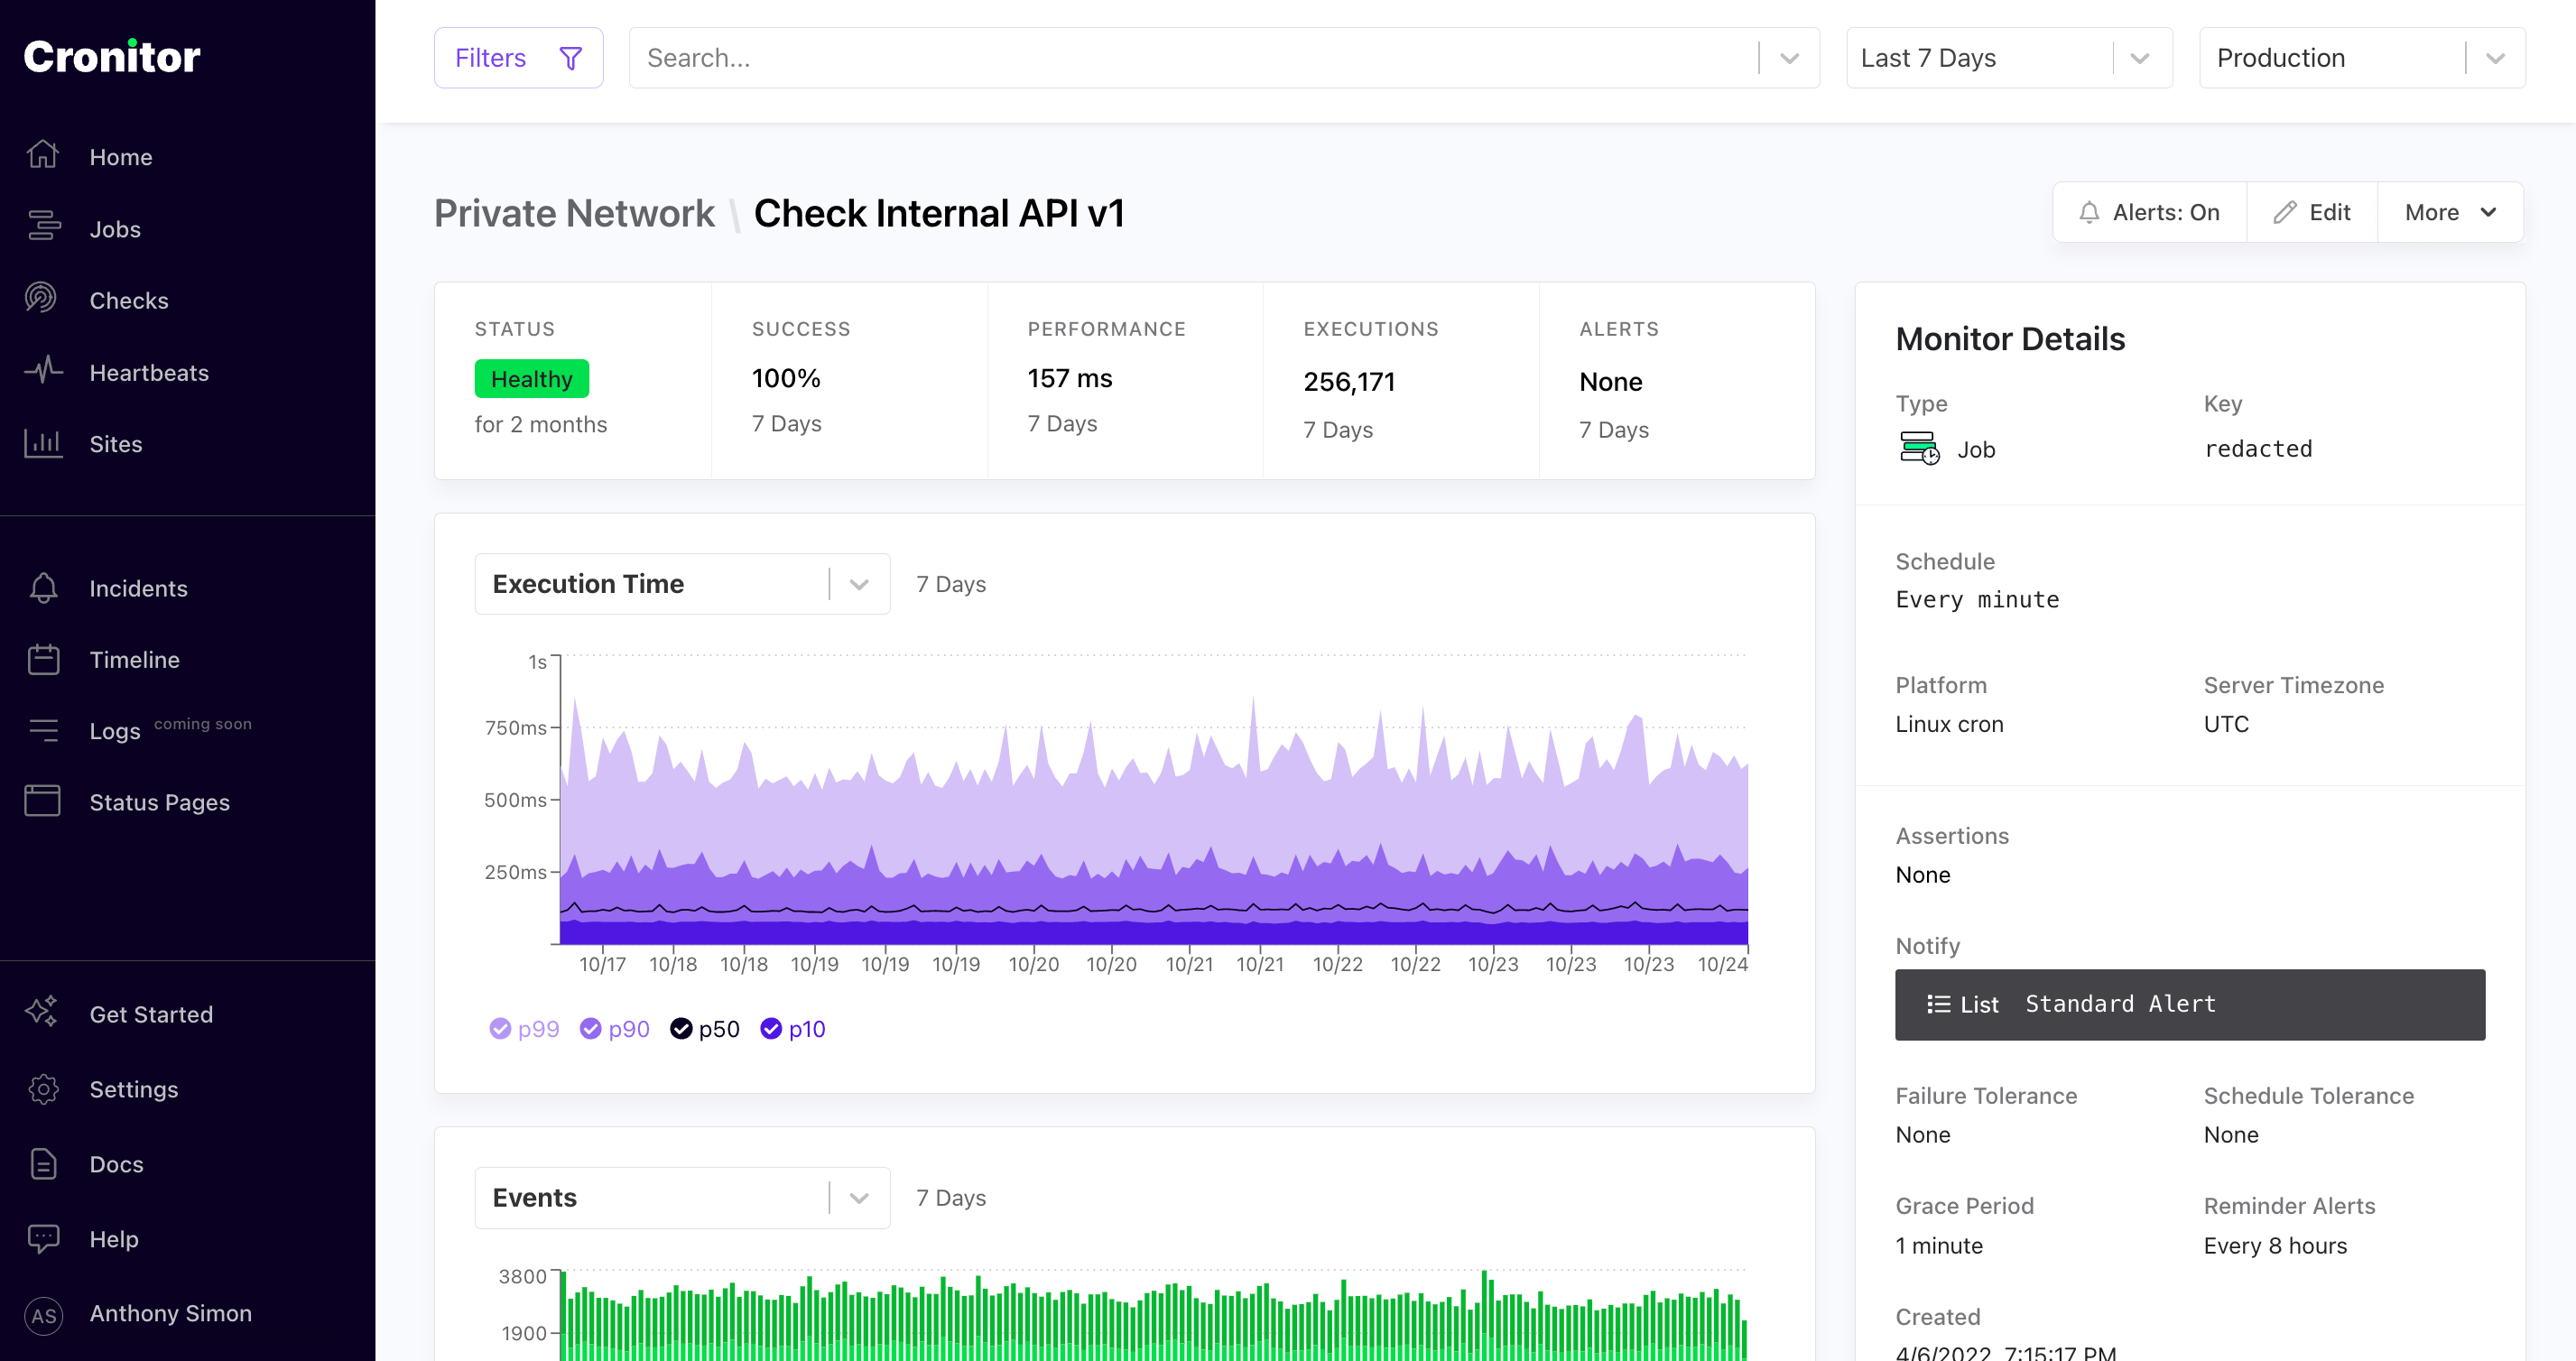
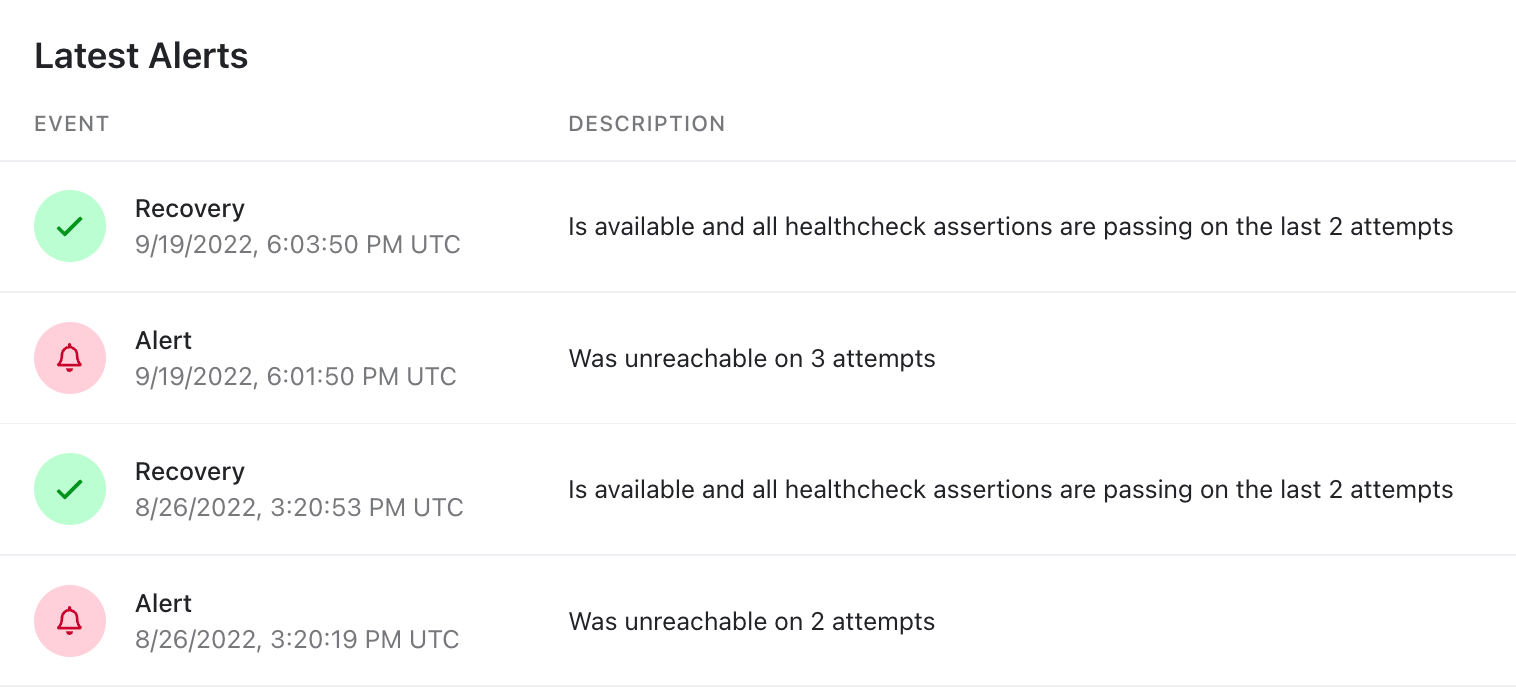
Whenever one of the uptime checks for our internal APIs fails, Cronitor will send an alert to the notification channels you configure, including response time, error logs and plenty of useful information to help you troubleshoot the issue.
Conclusion
In this guide, you’ve learned how to monitor private APIs and endpoints which are not meant to be exposed over the public internet.
This method works great because you don’t need to open ports on your firewall or setup a NAT so be able to monitor the uptime and performance of internal services.
Hope you found this article useful. Let us know if you have any questions or feedback!