Uptime Monitoring
What is Website Monitoring?
Website monitoring is the process of regularly evaluating and testing your website's availability, performance, and functionality to ensure that your site is providing a good experience for users.
When done well, a comprehensive website monitoring strategy can help you better understand the performance of your site, get timely alerts about any problems, and identify high-impact areas for improvement.
Before you set up your website monitoring infrastructure, it’s important to first understand why website monitoring matters, how it works, and the different forms of website monitoring that you can use to improve your business. Cronitor’s check product is documented in Website & API monitoring. This page is the overview.
Why Website Monitoring Matters
Website monitoring helps you collect and analyze data from your website to further optimize its performance, resolve high-impact issues, and feel comfortable that your site is operating as you expect. While having a robust website monitoring setup may seem like an obvious thing to do, many businesses underestimate how regularly monitoring their website’s performance can help identify and resolve costly problems for the business.
For example, imagine that you have performance monitoring on your website to learn about your site's speed and responsiveness. You may learn that images on a critical page are slow enough that people leave. How to read a page-load timeline is in page load time.
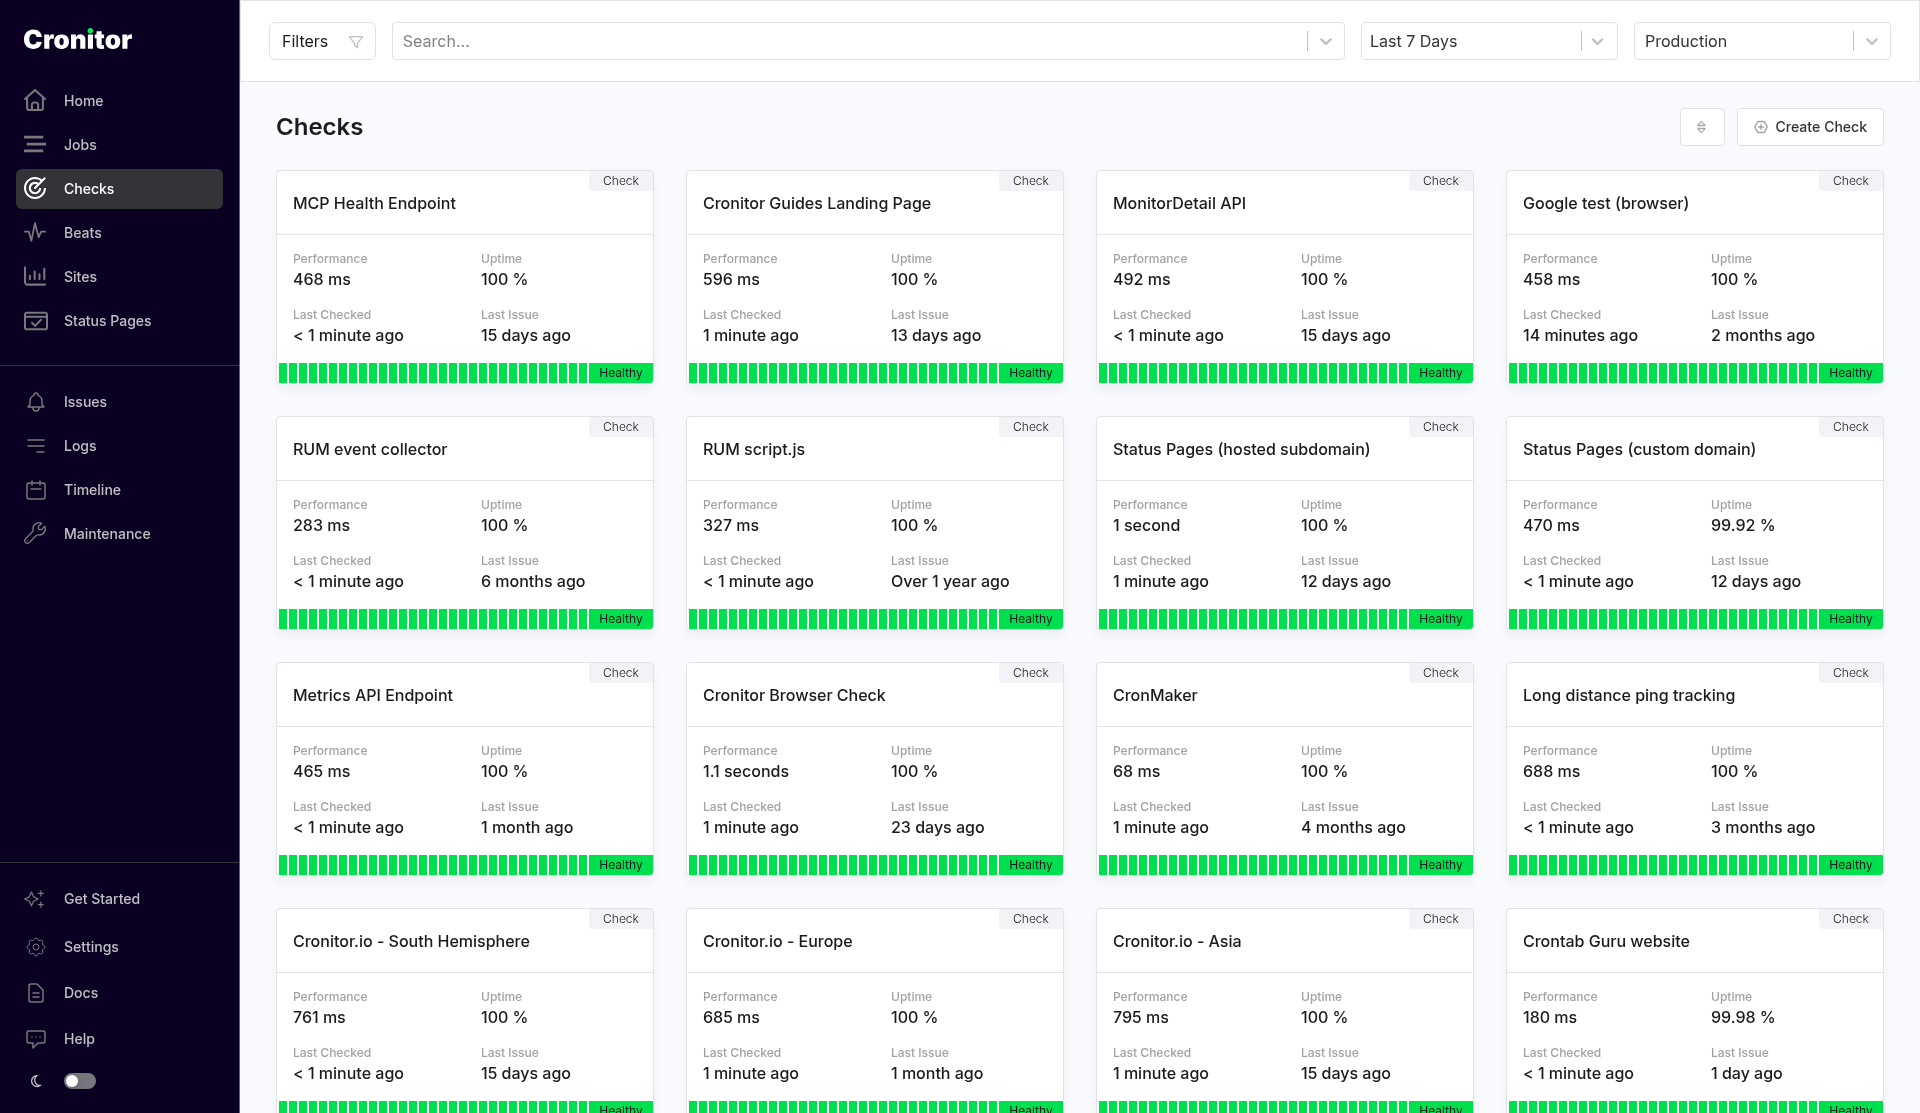
Armed with this data, you can diagnose the cause of the problem (for example, images are too large) and change it (resize or reformat the images). With monitoring in place, you can measure whether the change reduced the churn on that page.
This simple example is one of the many ways that website monitoring can improve the performance of your site and directly impact your bottom line. Below are a few additional ways that a strong website monitoring foundation can have a big ROI for your business.
- Building and maintaining the reputation of your business: Regardless of what your business does, it’s critical that your website remains available to users at all times. If your website goes down regularly or does not work properly, your customers will lose trust in your brand and offering. With uptime monitoring, a key form of website monitoring, you can easily ensure that your site is available and running smoothly at all times.
- Customer conversion and retention: If your website has a poor user experience when a customer tries to complete a key action, they might switch to other sites offering similar services or products. With error and performance monitoring, you can minimize these types of situations.
- Maintaining your site's ranking: You can use website monitoring to improve your site’s speed, availability, and other performance indicators that search engines value. With better overall performance, you will get more out of the investments you make in optimizing your site for search engines.
- Understanding user behavior: With real user monitoring, you can gain valuable insights about how users are interacting with your website. This information can help you identify improvements on the site, including design and technical changes that will enhance the user experience and increase conversion rates.
How Website Monitoring Works
Website monitoring is a broad umbrella for a suite of monitoring tools that collect and track valuable insights about your users and website performance.
For most website monitoring needs, you use simple scripts that leverage real user monitoring and synthetic testing to do everything from tracking how users engage with your site, to monitoring the availability of APIs, to alerting you when a key conversion rate drops below a critical threshold.
You can build some of this yourself. A check, a real user monitoring snippet, and a status page cover the usual set, and the results land in one account.
But before you choose a monitoring tool to track and evaluate the key metrics about the performance of your website, let’s first discuss the different types of website monitoring that you can leverage for your business.
Types of Website Monitoring
1. Uptime Monitoring
Uptime monitoring regularly requests a URL and alerts you when the response fails an assertion. Without that, you wait until a user reports the problem.
If your website serves people in more than one region, check it from more than one region. A site can answer in one place and time out in another. Cronitor’s regions are listed in the uptime docs. A check confirms a failure from another region before it pages you.
The same check type covers the APIs those pages call. Payment, shipping, and other third-party APIs belong in the same setup. See API monitoring.
A check can assert on status code, response time, body or JSON, headers, and certificate expiry. HTTPS checks verify the certificate unless you turn that off. Browser checks load the page in Chrome when the site depends on JavaScript. They are available on paid plans. Intervals run from 30 seconds to 24 hours. On the free plan the shortest interval is 5 minutes.
Checks are made from Cronitor’s public regions. If a firewall can allow a fixed set of source addresses, turn on Use Static IPs for Checks in account settings and allow the list at cronitor.io/ips.txt. The free plan cannot enable static IPs. If the host is not reachable from the internet, do not open it for the probe. Run the request inside the network and report the result as a job. See Monitoring Private Endpoints and APIs.
2. Real User Monitoring (RUM).
Real user monitoring (RUM) records what browsers actually did: pageviews, page load time, Core Web Vitals, and JavaScript errors. Cronitor’s script is cookie-free. You can filter by time, location, and referrer. Install steps are in the RUM quickstart.
RUM goes quiet when nobody can load the site, so it does not replace an uptime check. It does show which pages are slow or throwing errors for the people who do get through. Browser-side error tracking is covered in frontend monitoring.
3. Synthetic Monitoring
Synthetic monitoring uses a scripted request, or a browser, to act out a path on a schedule. Uptime checks and API checks are synthetic monitors: Cronitor makes the request whether or not anyone is visiting.
Synthetic testing is different than real user monitoring in that it allows you to test how your site is performing in different locations and under various conditions without needing any users. It can therefore be used in a production environment and to proactively test performance under certain conditions on the timeline you want.
While synthetic monitoring is beneficial on its own, it is especially powerful when used in conjunction with real user monitoring to deliver insights that help you identify errors, test existing and new conditions, and make improvements.
4. API Monitoring
API monitoring is the same check pointed at an API: status, latency, and whether the body still matches what you asserted. An MCP server is one case, covered in Monitor an MCP Server.
For example, if you run a business that uses a third-party API to help manage the shipping and logistics of your business, you will want to know as soon as possible if that API is down or has any relevant issues. That's the type of information that API monitoring can provide you for all of the APIs that you use in your business, and this information can be the difference between a disastrous situation for your customers and a small blip that's fixed in short order.
5. Error Monitoring
Error monitoring is the process of tracking and analyzing errors on your site or application. With error monitoring, you can quickly detect and diagnose site errors, bugs, and other issues that may impact the performance of your site and the experience for users.
The main benefit of error monitoring is that you can quickly identify and resolve issues that may lead to a poor user experience. With error monitoring software, you can continuously monitor your site and relevant applications to learn about issues in real-time.
In Cronitor, JavaScript errors on a page come from real user monitoring. A failed check is a separate signal: the URL did not meet its assertions.
Error monitoring often comes in handy when you roll out any changes to your site. For example, imagine that you restructure your company blog. Ideally, you will have tested these changes before going live, but that's not always what happens.
With error monitoring in place, you may discover that the recent changes are causing certain pages to not render correctly. With this information, you can quickly diagnose the problem and deploy the fix.
6. SSL Monitoring
An SSL certificate authenticates a website's identity and allows for an encrypted connection. Each SSL certificate has a validity period and must be renewed once this period ends.
Failing to renew an SSL certificate on time or operating a website with an expired SSL certificate can lead to avoidable problems, such as making your website more vulnerable to attacks from hackers and spooking users with a warning message about your site not being secure.
To avoid these issues, you need to renew your SSL certificates at the right time. An HTTPS check in Cronitor verifies the certificate unless you turn that off, and you can add an assertion such as ssl_certificate.expires_in > 30 days so the warning arrives before the expiry. See Website & API monitoring.
7. DNS Monitoring
If a check cannot resolve the hostname, Cronitor records the failure the same way it records a refused connection. That tells you the name did not answer from the probe region. It does not collect your DNS query logs. Query logs belong in your DNS provider.
8. Performance Monitoring
Performance monitoring can help you understand how your website is performing under a variety of conditions. For example, you can use both synthetic monitoring and real user monitoring to measure the page speed of critical pages on your site.
Because page speed is an important ranking factor and can impact things like the conversion rate of your users, this type of monitoring can help you identify critical business areas where your site is not performing as well as it could.
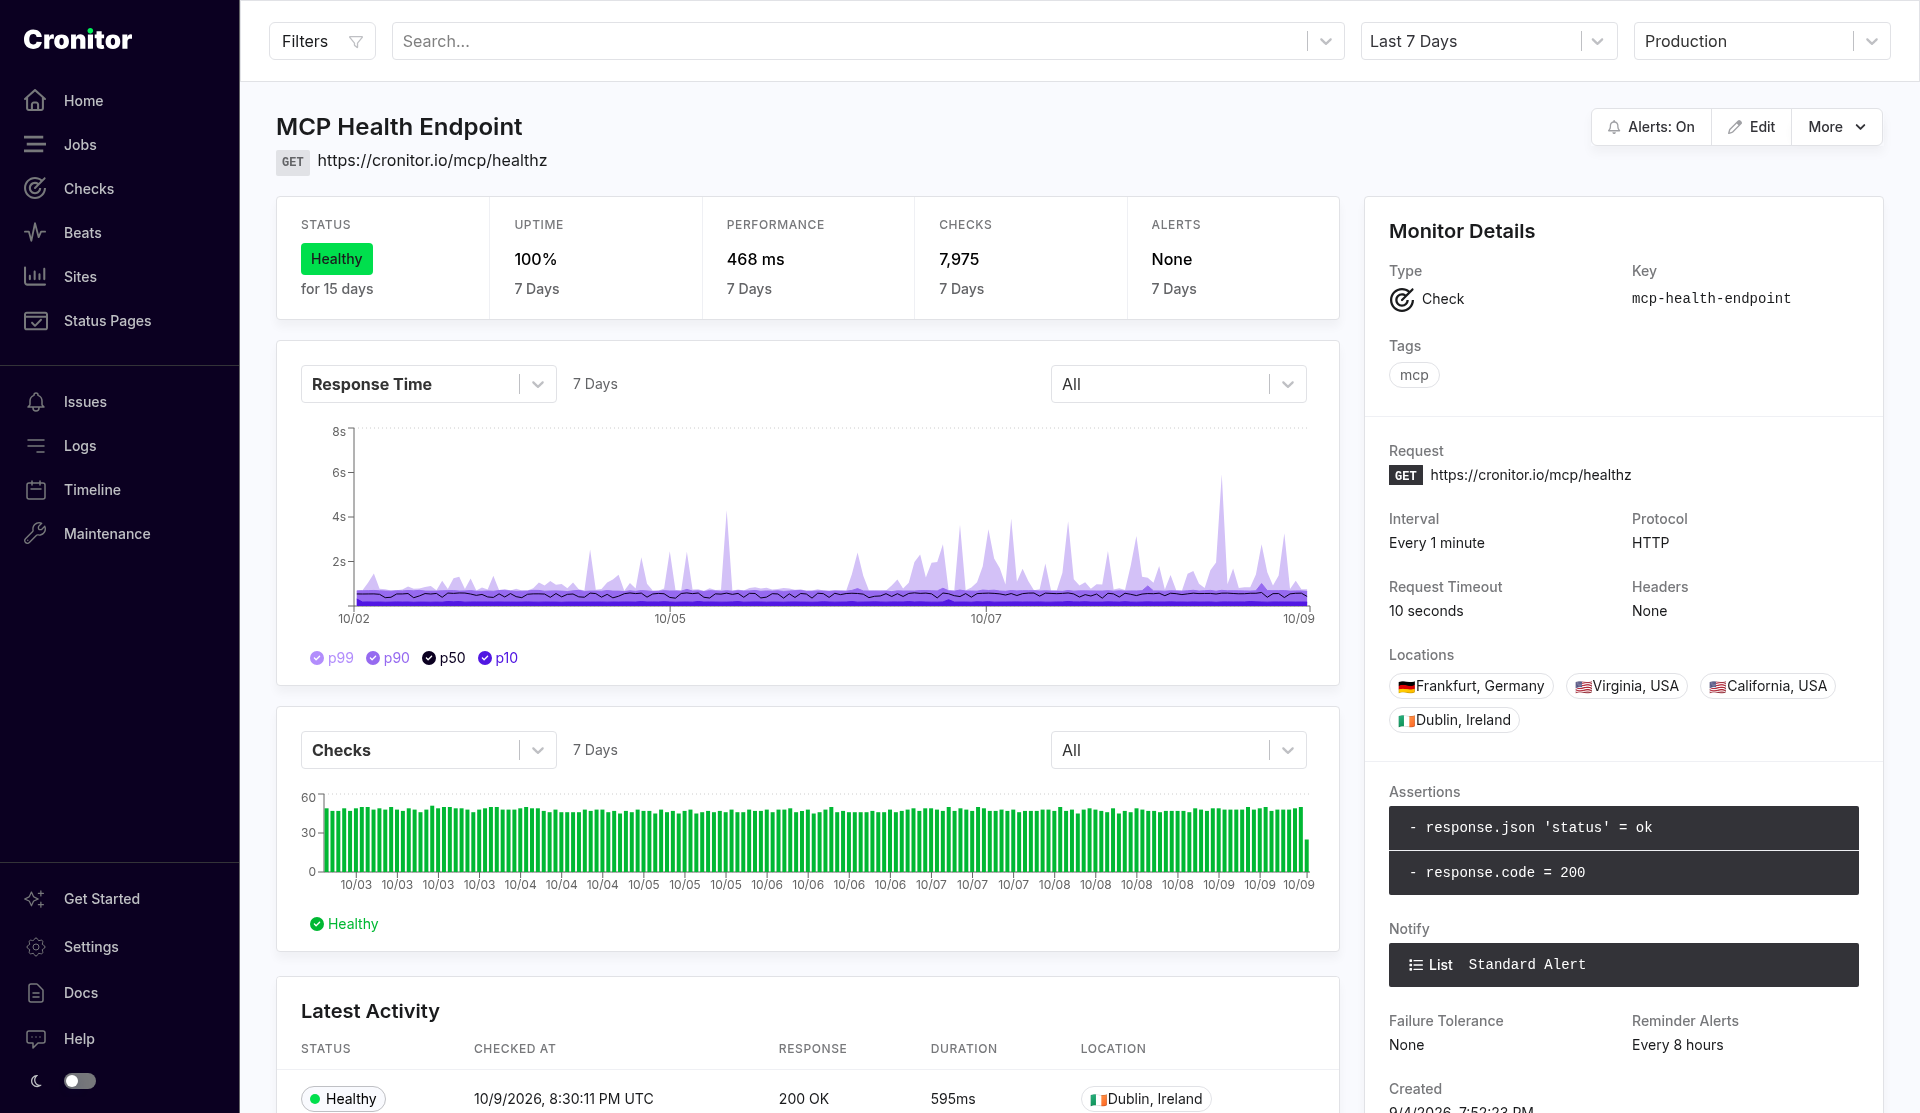
The chart below is response time for an HTTP check over seven days, with percentile bands. That number is how long Cronitor’s request took. A browser page-load timeline is a different measurement, covered in page load time.
9. Bonus: Status Pages
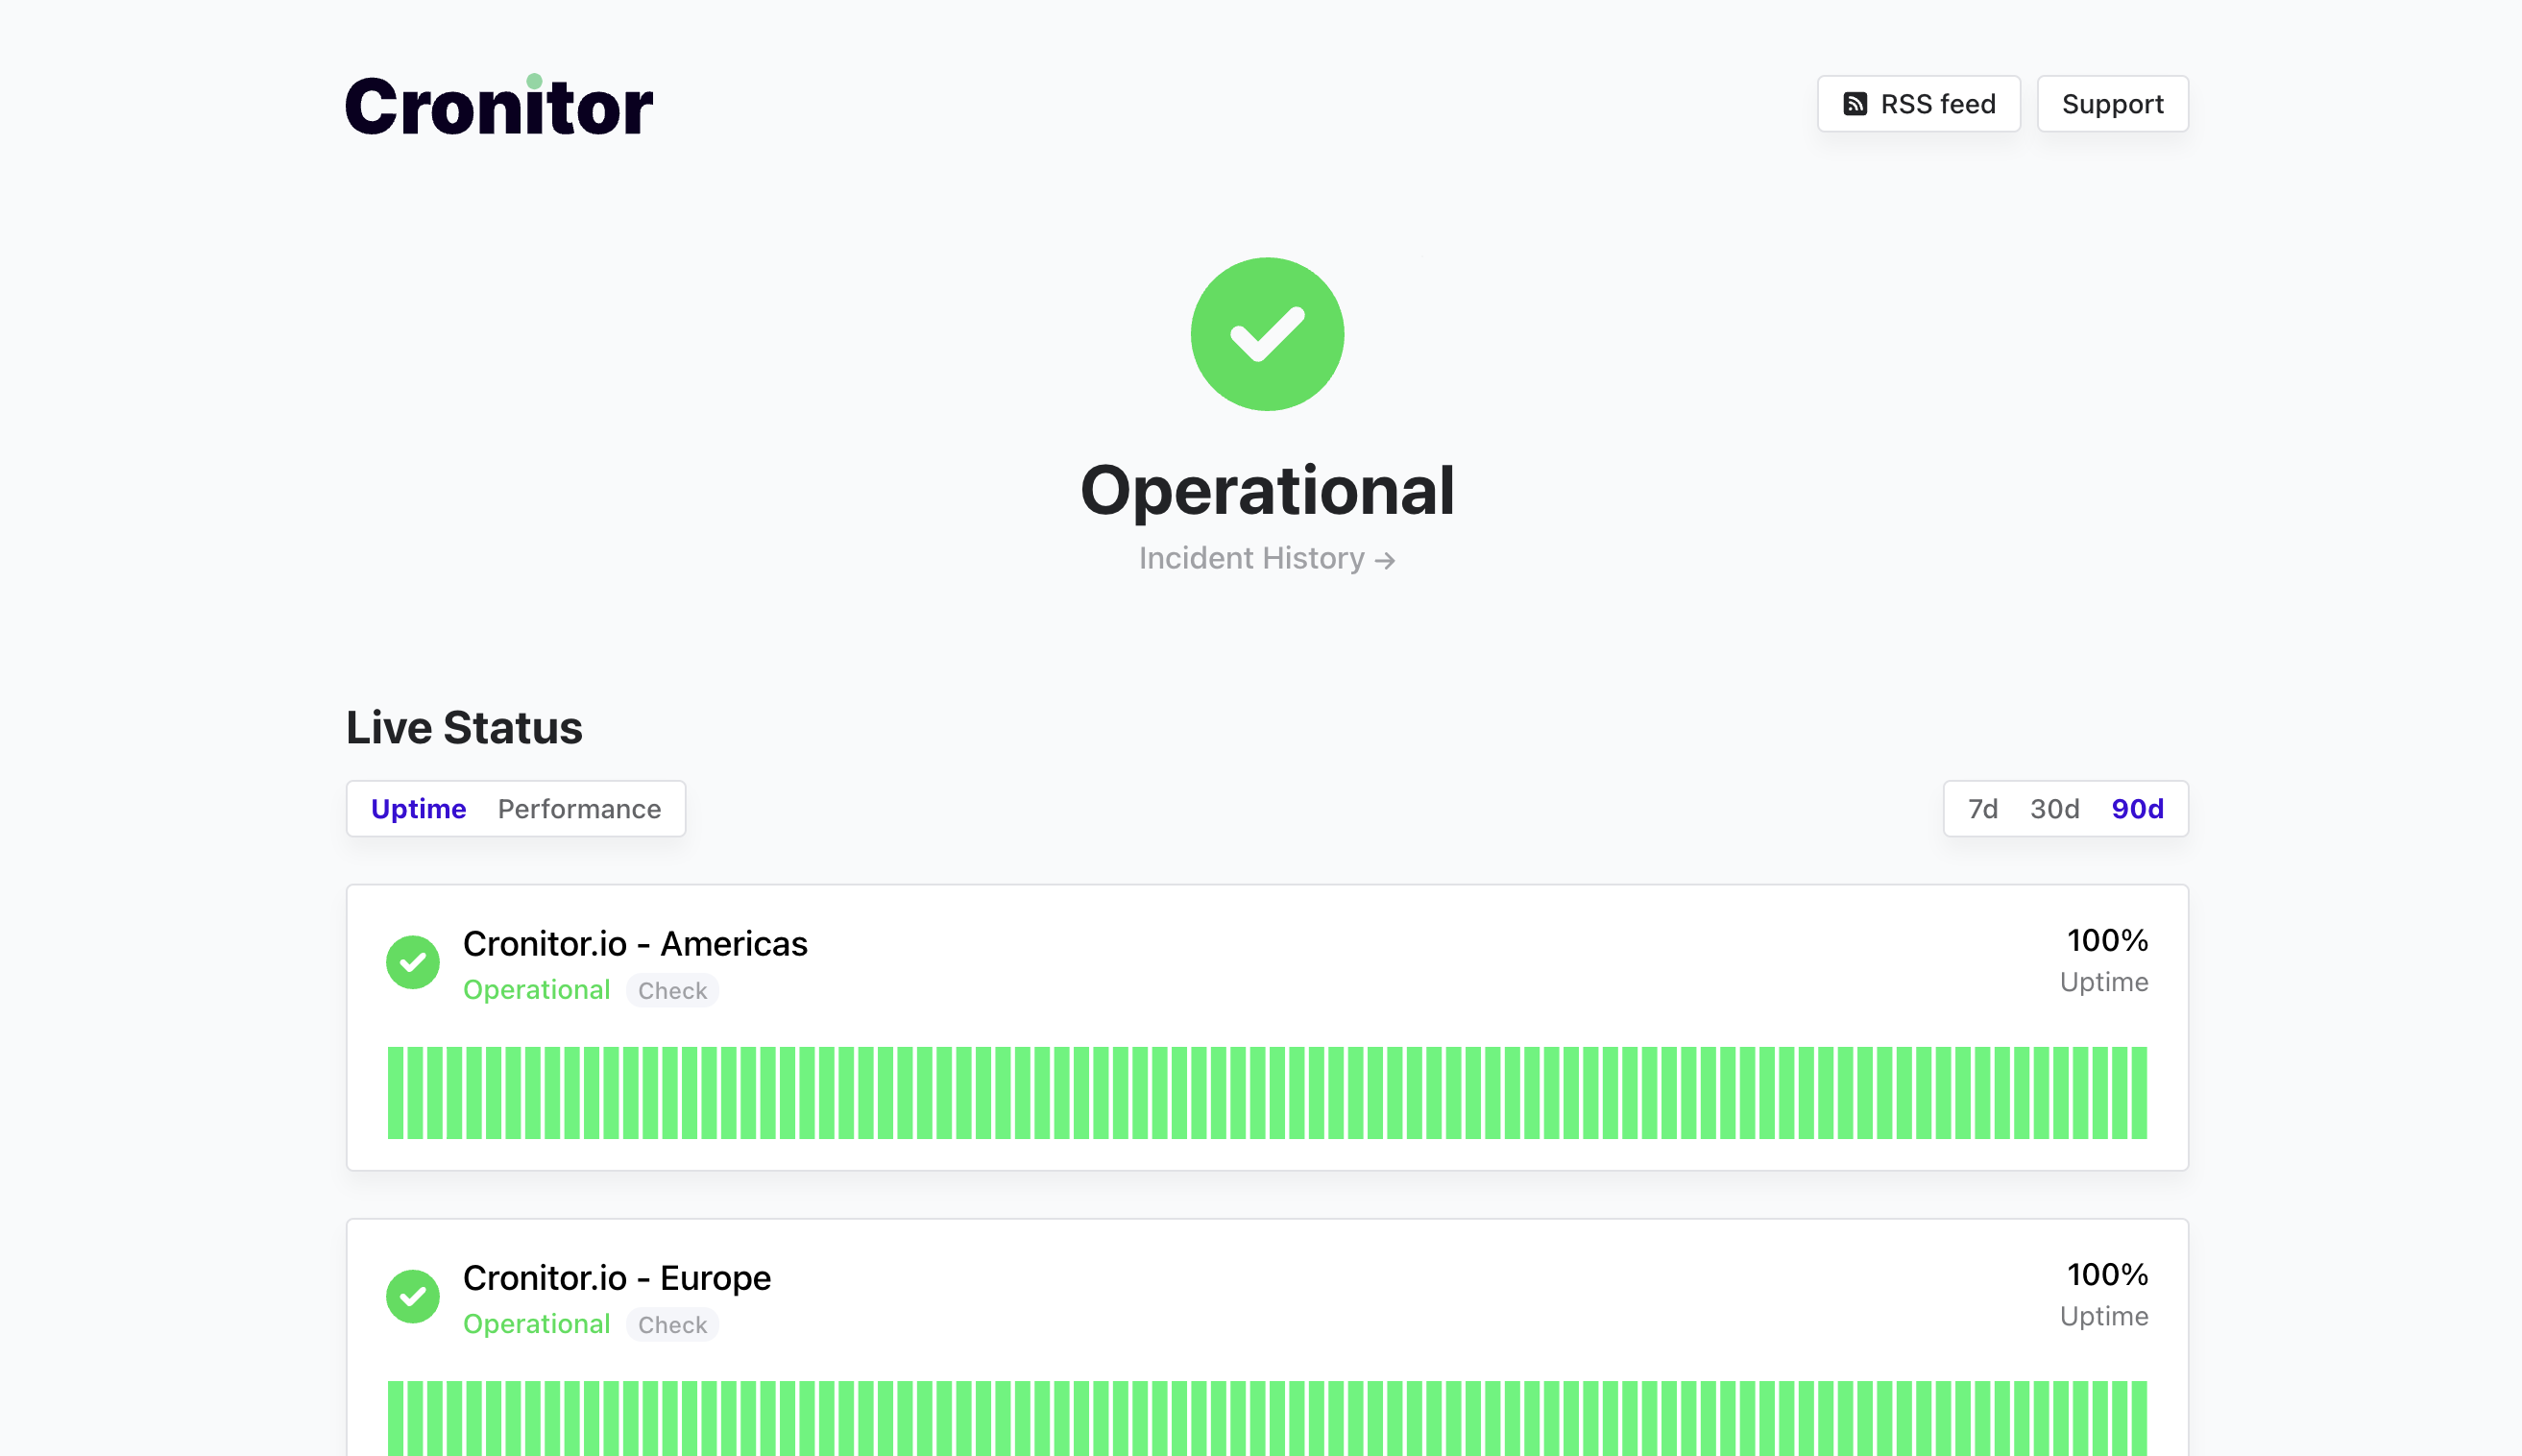
Status pages publish the state of the monitors you choose. You can post incidents and maintenance there, and you can keep a page private. The longer walkthrough is the status pages guide.
Providing end users access to your status pages will help build trust through proper communication and transparency. As a best practice, you should share the status-page information with new users as part of their onboarding to ensure that they are aware of important information in advance, like in the case of an upcoming maintenance schedule.
Below is a sample status page created using Cronitor status pages.
Choosing a Website Monitoring Tool
Choosing the right website monitoring tool is one of the most important decisions that you can make for your business. As you've learned in this article, website monitoring covers a wide array of tools and services that can help you do anything from understanding how your website is performing, to tracking the availability of key APIs, to getting alerts about errors and other mission-critical problems to the right parts of your organization.
In all likelihood, the full scope of your website monitoring strategy will be done with some combination of in-house tracking and various third-party website monitoring providers. When working with a website monitoring company, you will want to consider a few things to get the most out of any tool that you work with:
Meets most of your needs: While some web performance monitoring tools do really well with one specific form of monitoring, it's often best to work with a single company that can provide the majority of your website monitoring needs. Otherwise, you and your team will be burdened by managing a bunch of services and having data in too many different dashboards and places.
Simple onboarding: Your life will be a lot easier if the tool is easy to set up and fits the infrastructure you already have. A practical test is to add one uptime check and see whether the alert is usable. If it is, add the next monitor type from there.
Good usability: Data about the performance and availability of your site or application is only useful if it is provided to you in a readable and actionable manner. So while it's important to have a website monitoring service that collects the data you need, it's equally important that the service you use has an intuitive interface and provides you with dashboards and alerts that your team can quickly understand and action.
Best-in-class alerting: The truth is that you don't want to be logging into your website monitoring tool dashboard multiple times a day. What you want is to have alerts about any problems sent to you in a clear and timely manner. Look for a tool that provides you with customizable alerts, including allowing you to send those alerts to the channels where your team already communicates (e.g., Slack, email, SMS, etc.).
Data verification: When starting to work with a website monitoring service, you will want to make sure that the data is accurate so that you can trust any actions you take from that data. Look for a service that allows you to audit and verify the data that appears in your dashboards and alerting systems.
Cronitor keeps uptime checks, API checks, RUM, and status pages in one account. Jobs and heartbeats live next to them when the thing you care about has no URL to request.