Getting started with Cronitor RUM
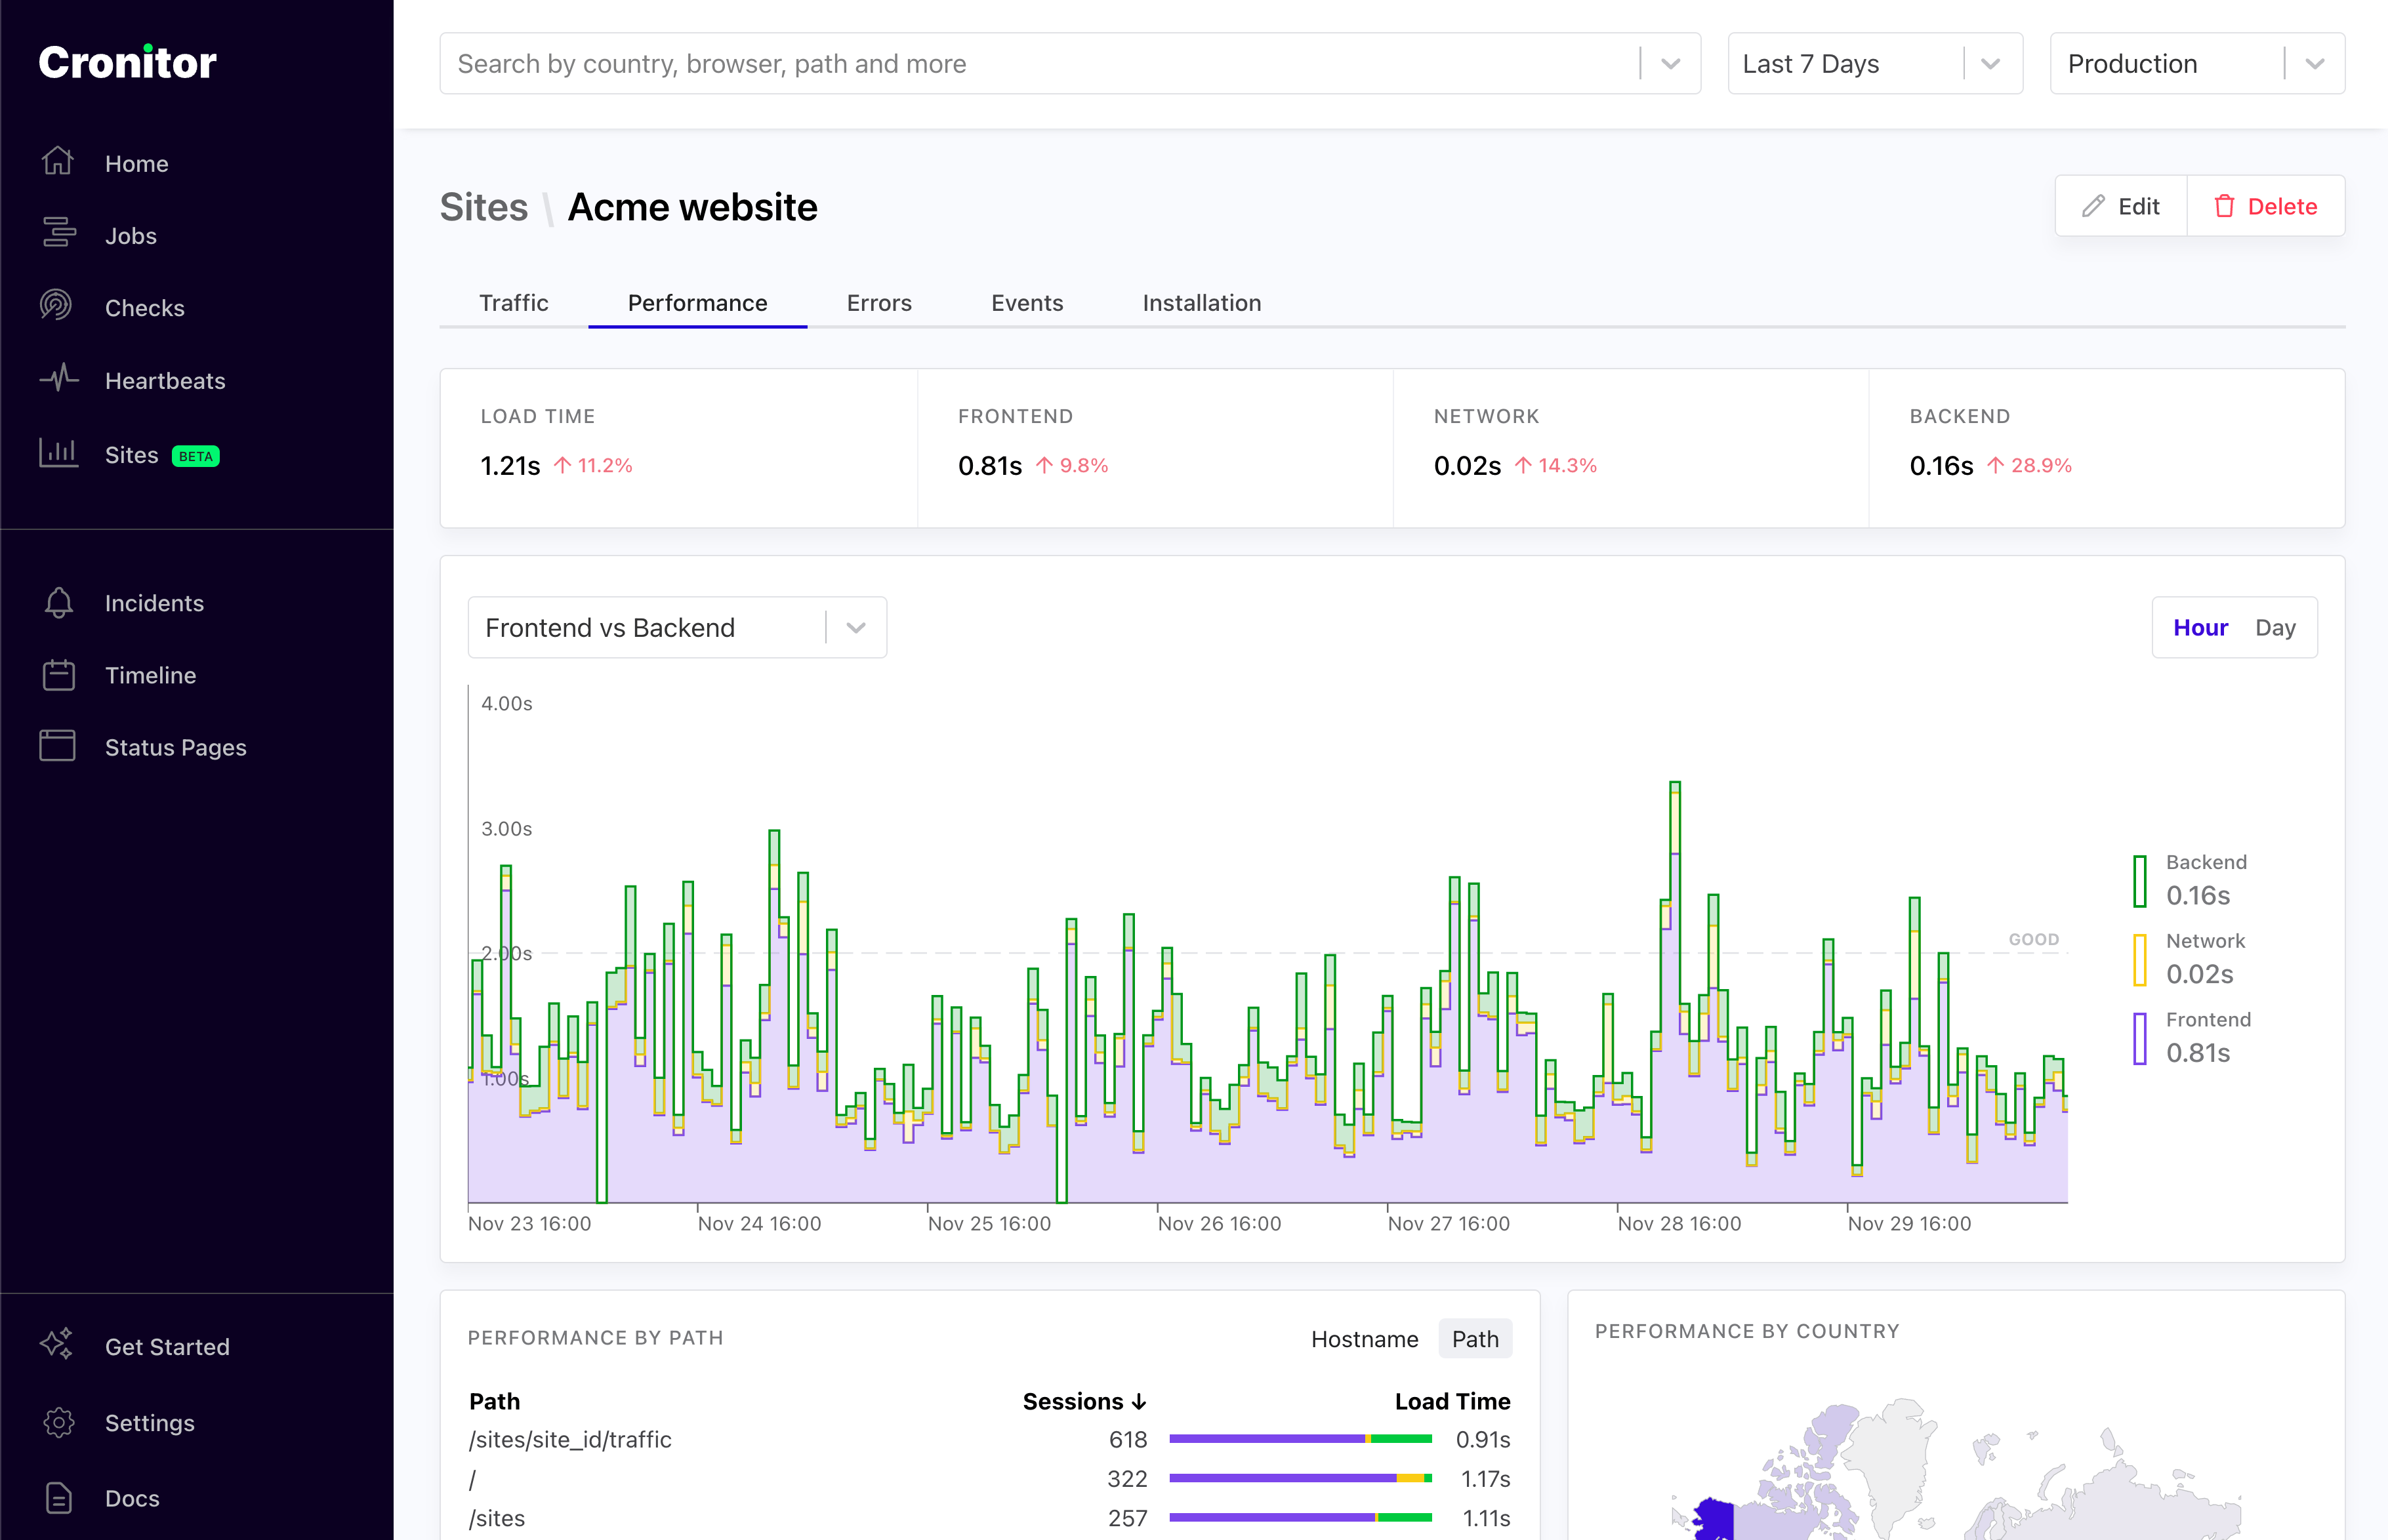
Real User Monitoring (RUM) enables you to monitor your website's most important metrics, in real time. This includes metrics such as Core Web Vitals, Page Load Time, Sessions over time, by country and more.
In this tutorial, you will learn how to monitor your frontend using Cronitor RUM.
Step 1: Add your Site
In your Cronitor dashboard, go to Sites and fill in the details for it.
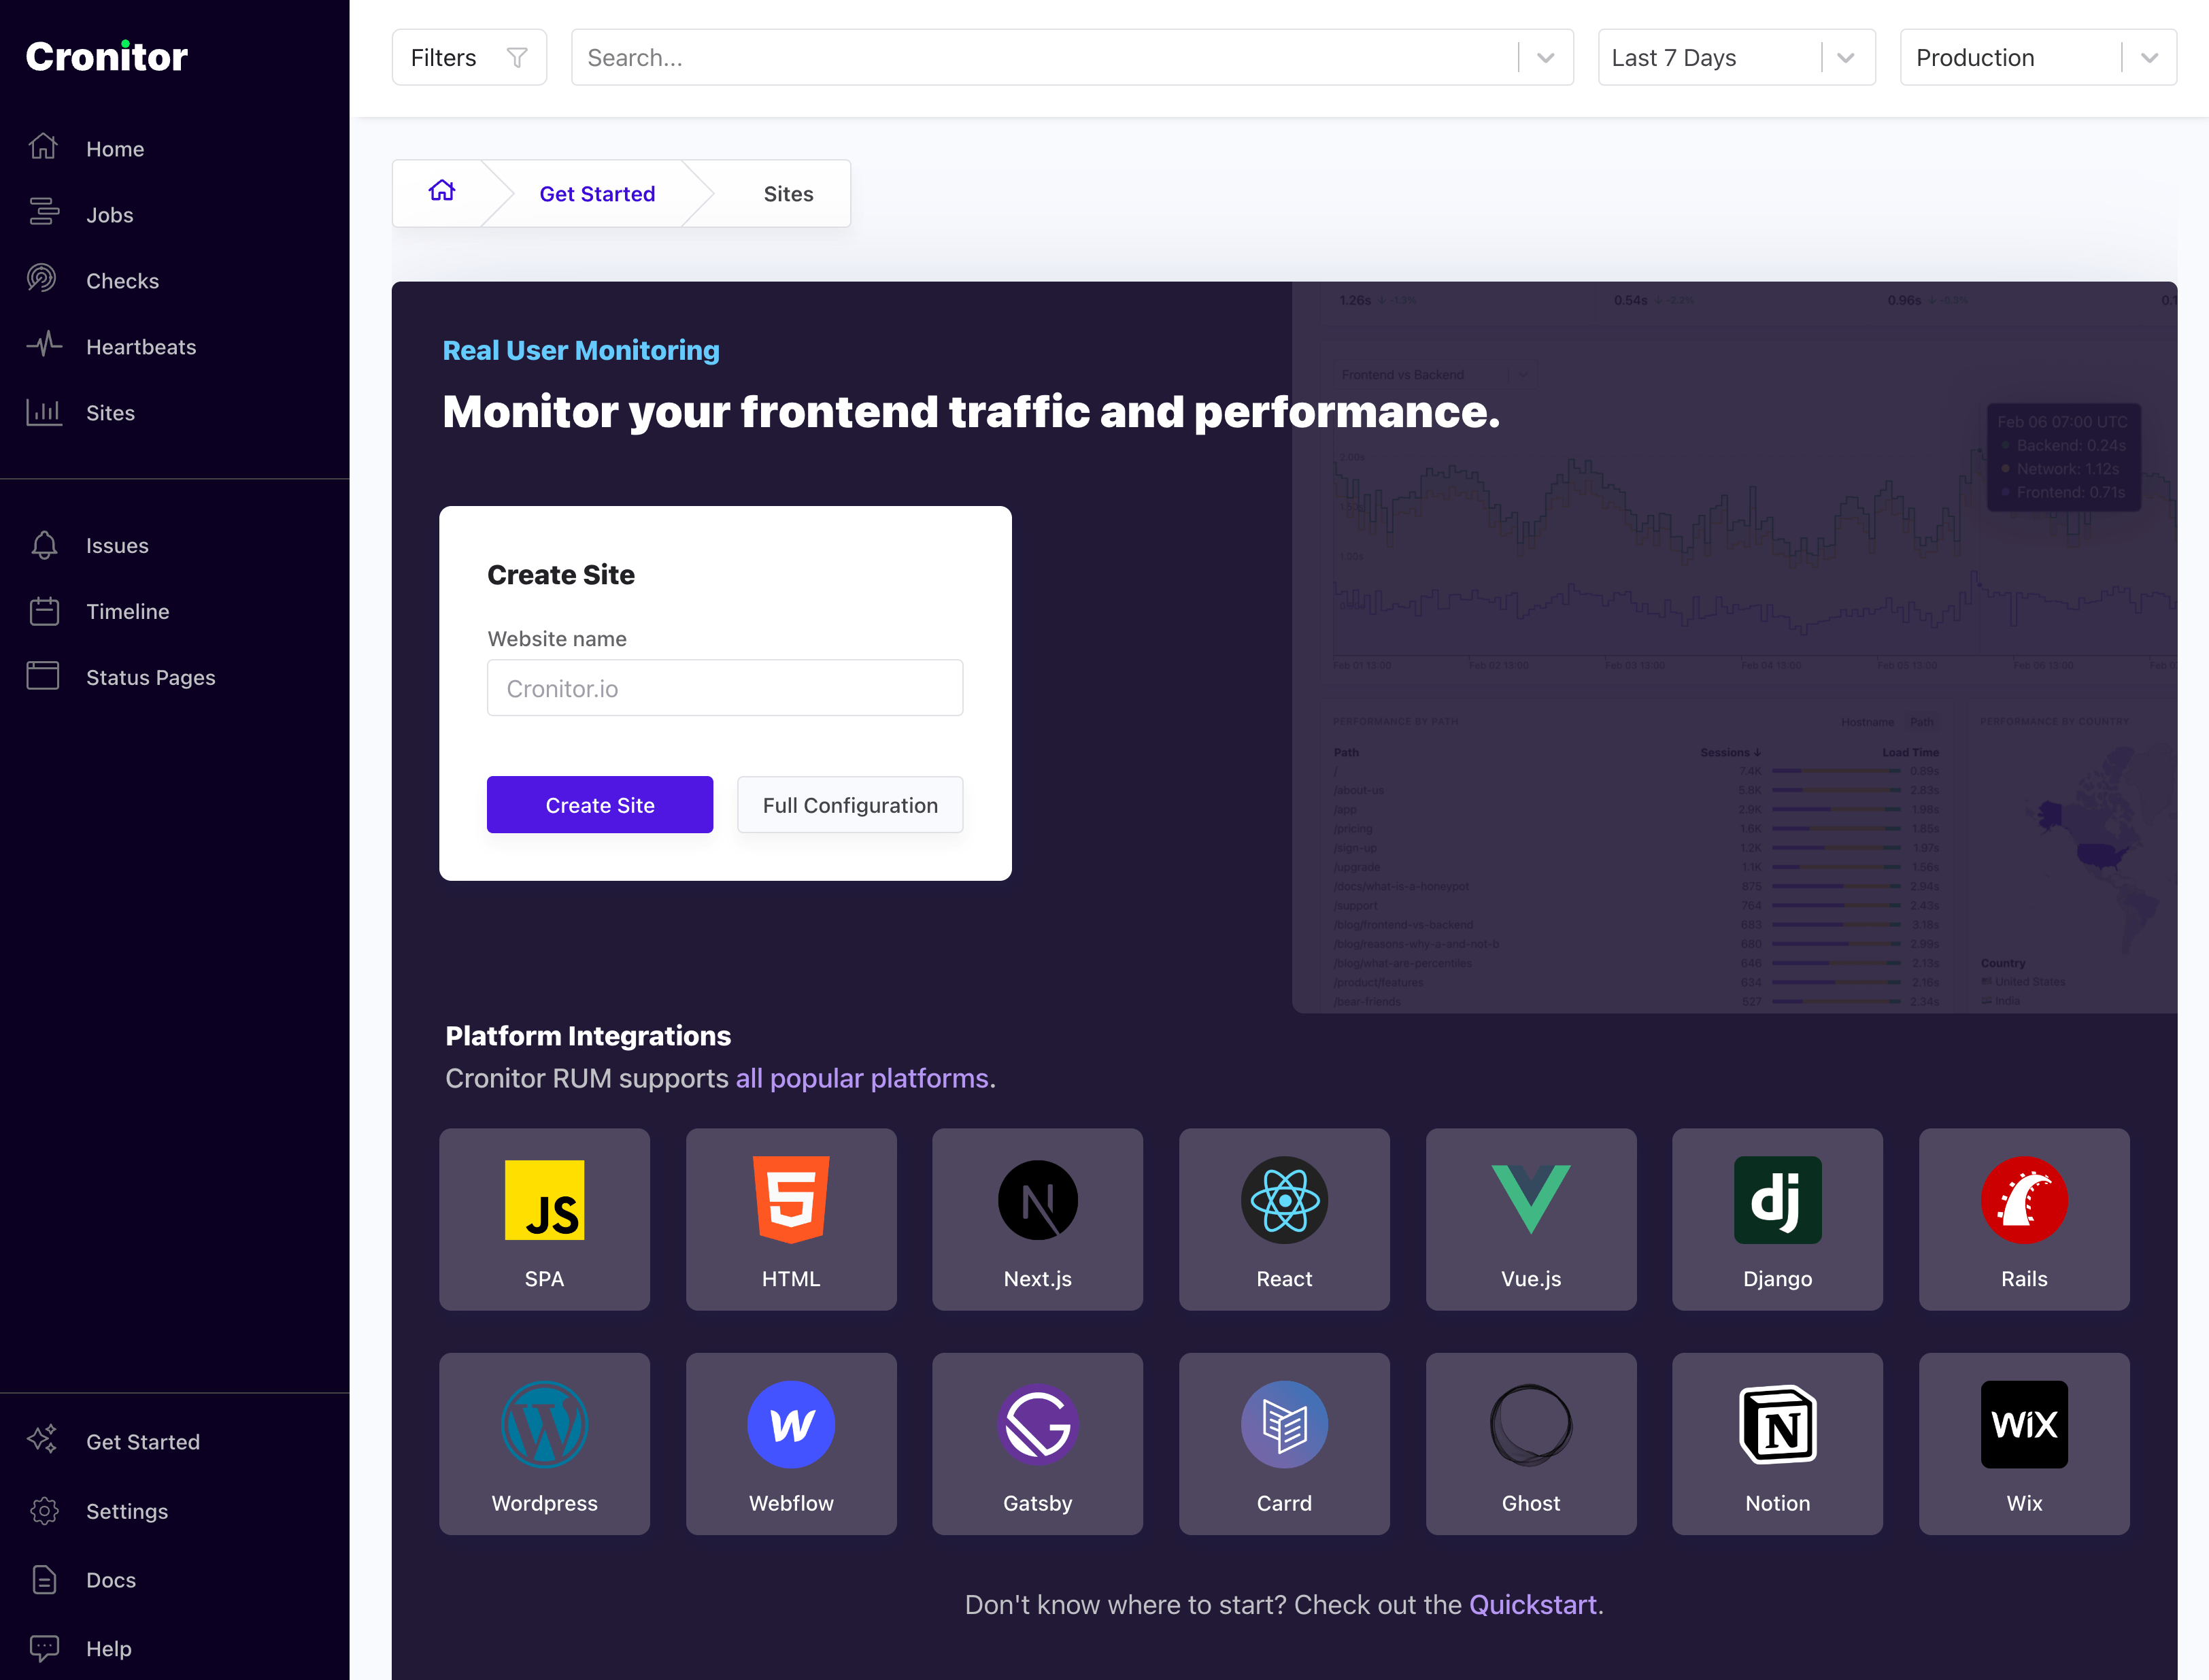
You can pick any name you'd like. It's just to help you recognize it later in case you have multiple sites.
This name can be changed anytime, and is not tied to your domain. In other words if your domain name is www.example.com you can name your site something else like My Website.
Once you've created your site, you'll get a custom tracking snippet. The analytics snippet is a small piece of code that runs on your website, and it collects the metrics necessary to show you the insights in the dashboard.
![]()
Step 2: Install the SDK
Once you have added your website to Cronitor, all that is left to do is to install the tracking snippet on your website.
All you have to do is load this snippet as part of your website's HTML. The snippet works with any website or framework - simply add it to your HTML template or layout file.
Step 3: Collect pageviews
After you have added our analytics script to your website, you should be able to see pageviews show up in the dashboard within a minute of the visitors coming into your website.
P.S.: If you need help, you can always reach out to us at support@cronitor.io.
Next steps
- Control who can send events to your site with inbound filters.
- Instrument all your environments (eg. testing or staging).
- Track any interaction using custom events.
- Monitor multiple domains from one dashboard.