Platform
Web Analytics & Real-User Monitoring
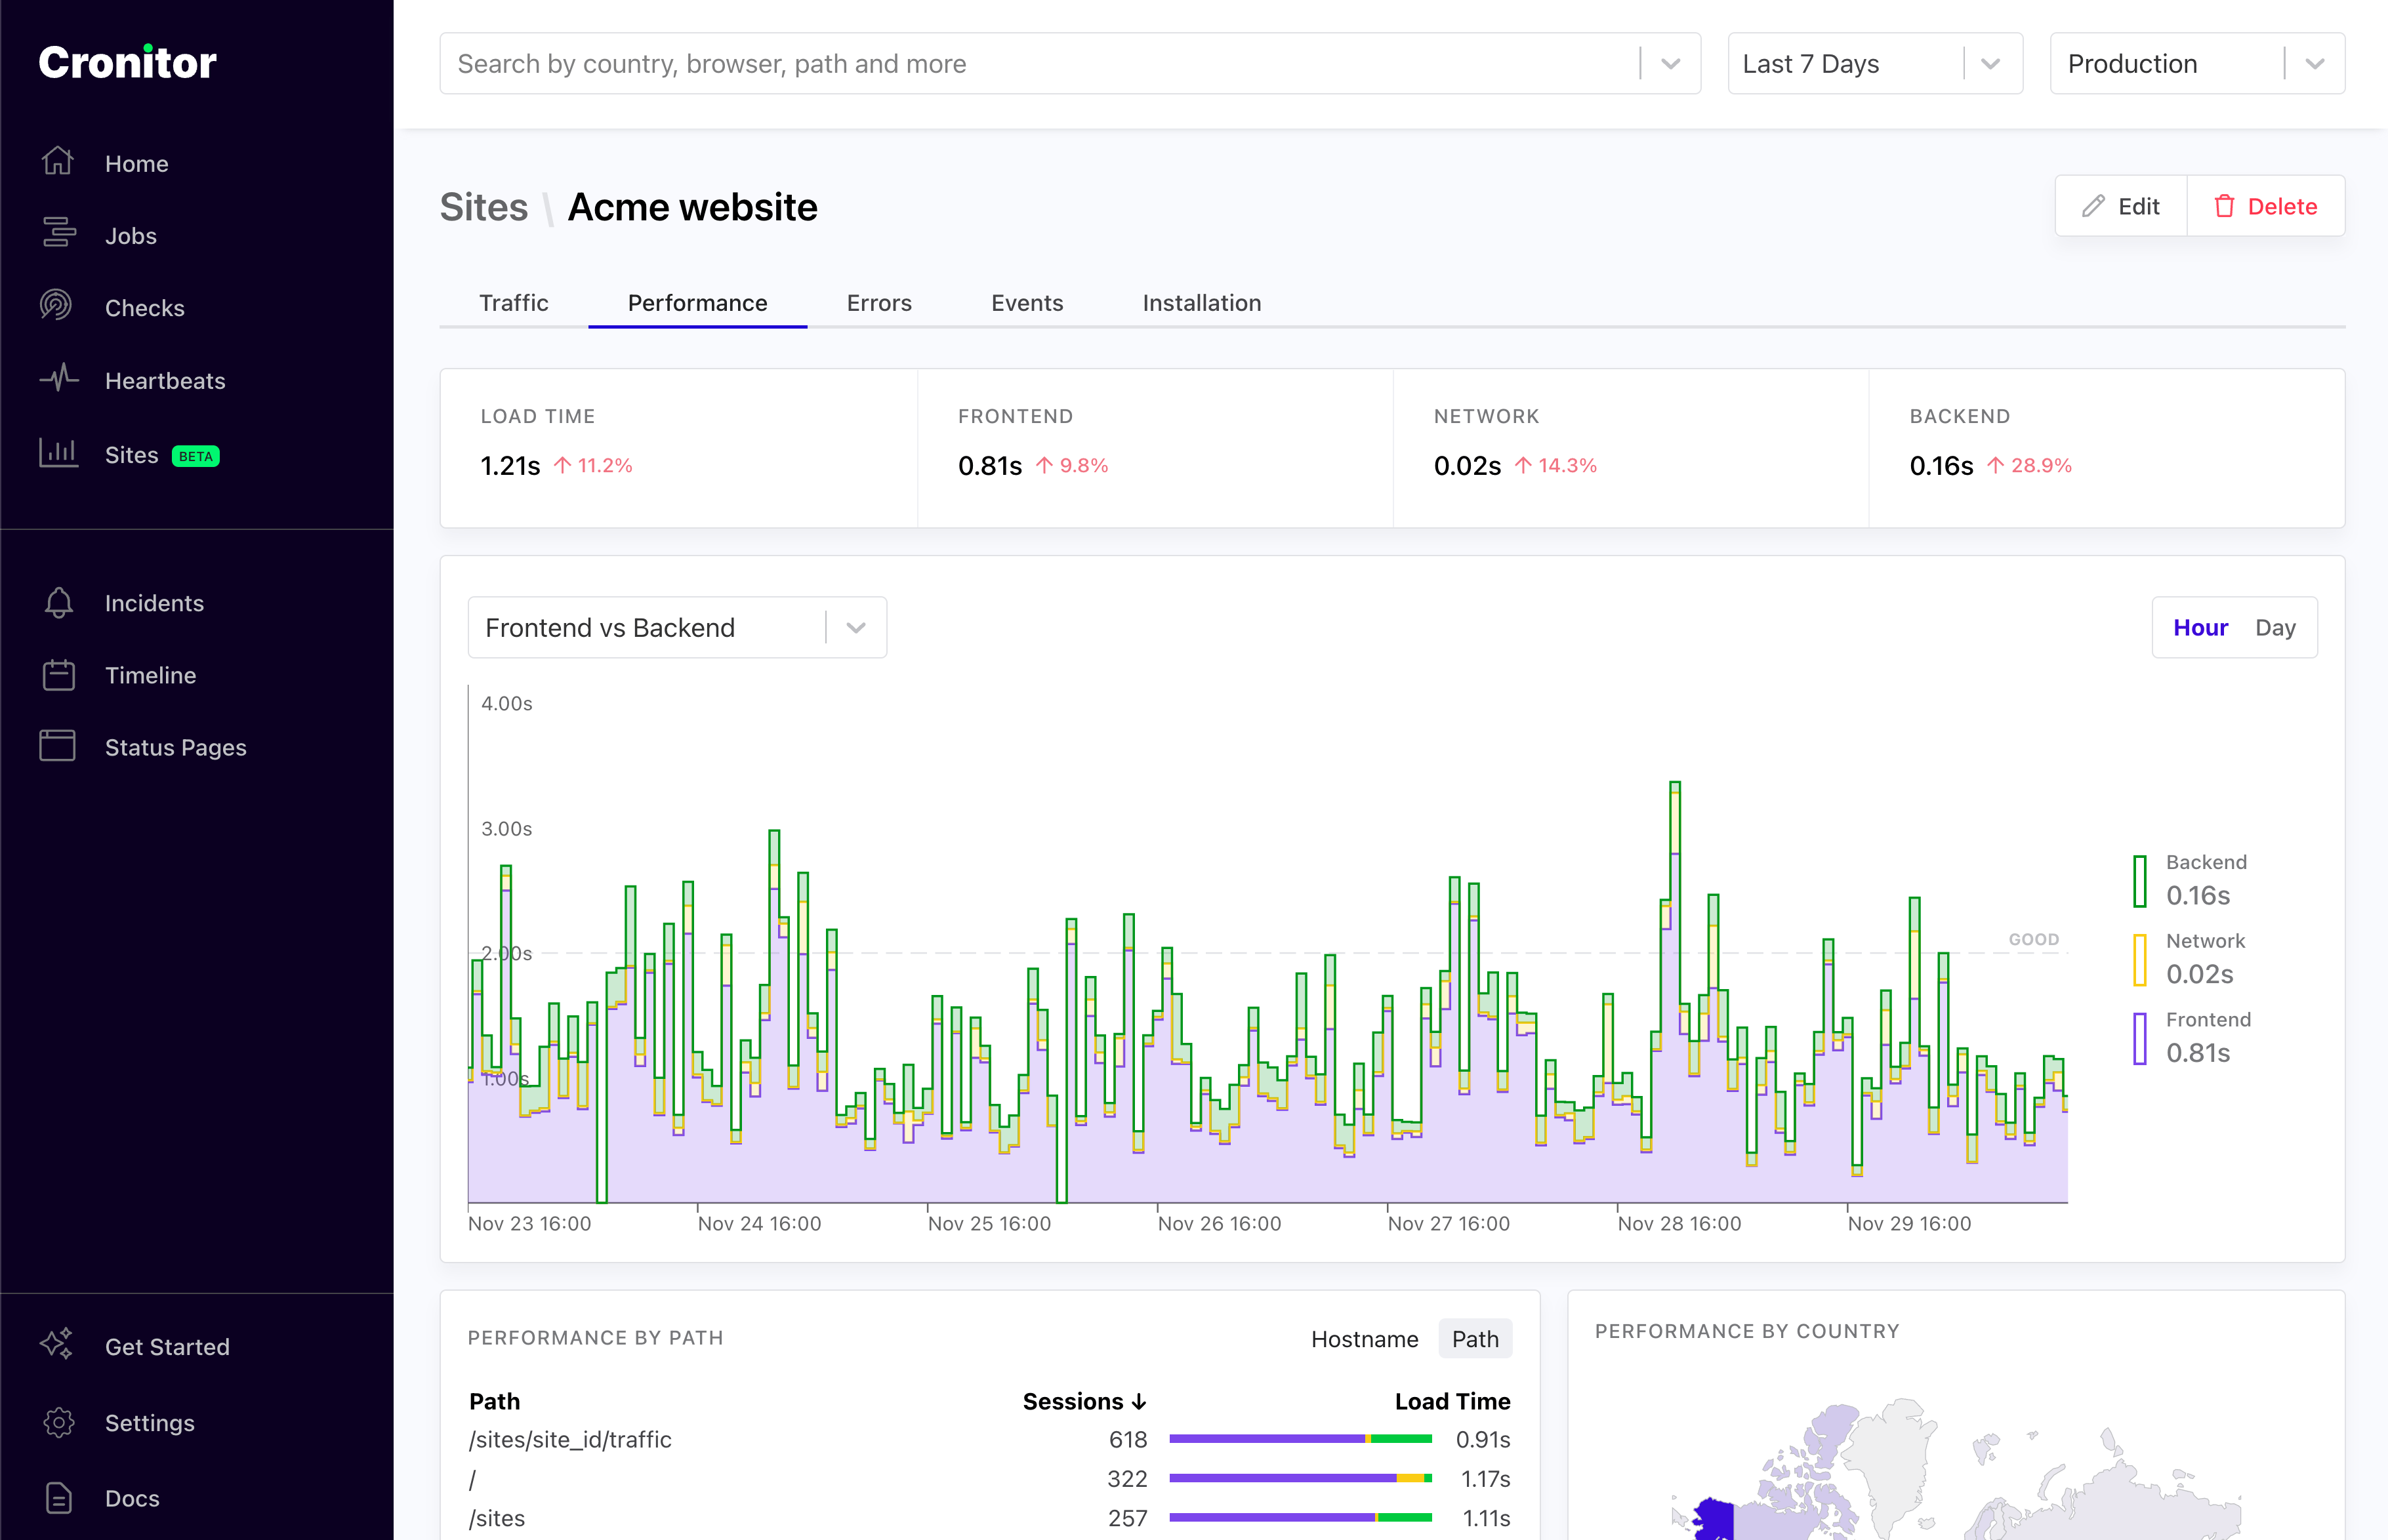
Cronitor's Web Analytics & Real-User Monitoring enables you to monitor your website's most important metrics, in real time. This includes metrics such as Pageviews, Core Web Vitals, Page Load Time, Errors and more. You can then filter and analyze your site date by time, location, referrer and many more. It's cookie-free, privacy-centric, and easy to configure.
These docs are broken into the following sections. Or jump to the Quickstart below.
Inbound Filters
Control whose events get recorded on your site.
Custom Events
Track custom events on your site.
Environments
Track your events per environment (staging, production, etc).
Multiple Domains
Track your events across multiple domains.
Common Questions
Common questions about Real User Monitoring
Quickstart
Step 1: Add your Site
In your Cronitor dashboard, go to Sites and fill in the details for it.
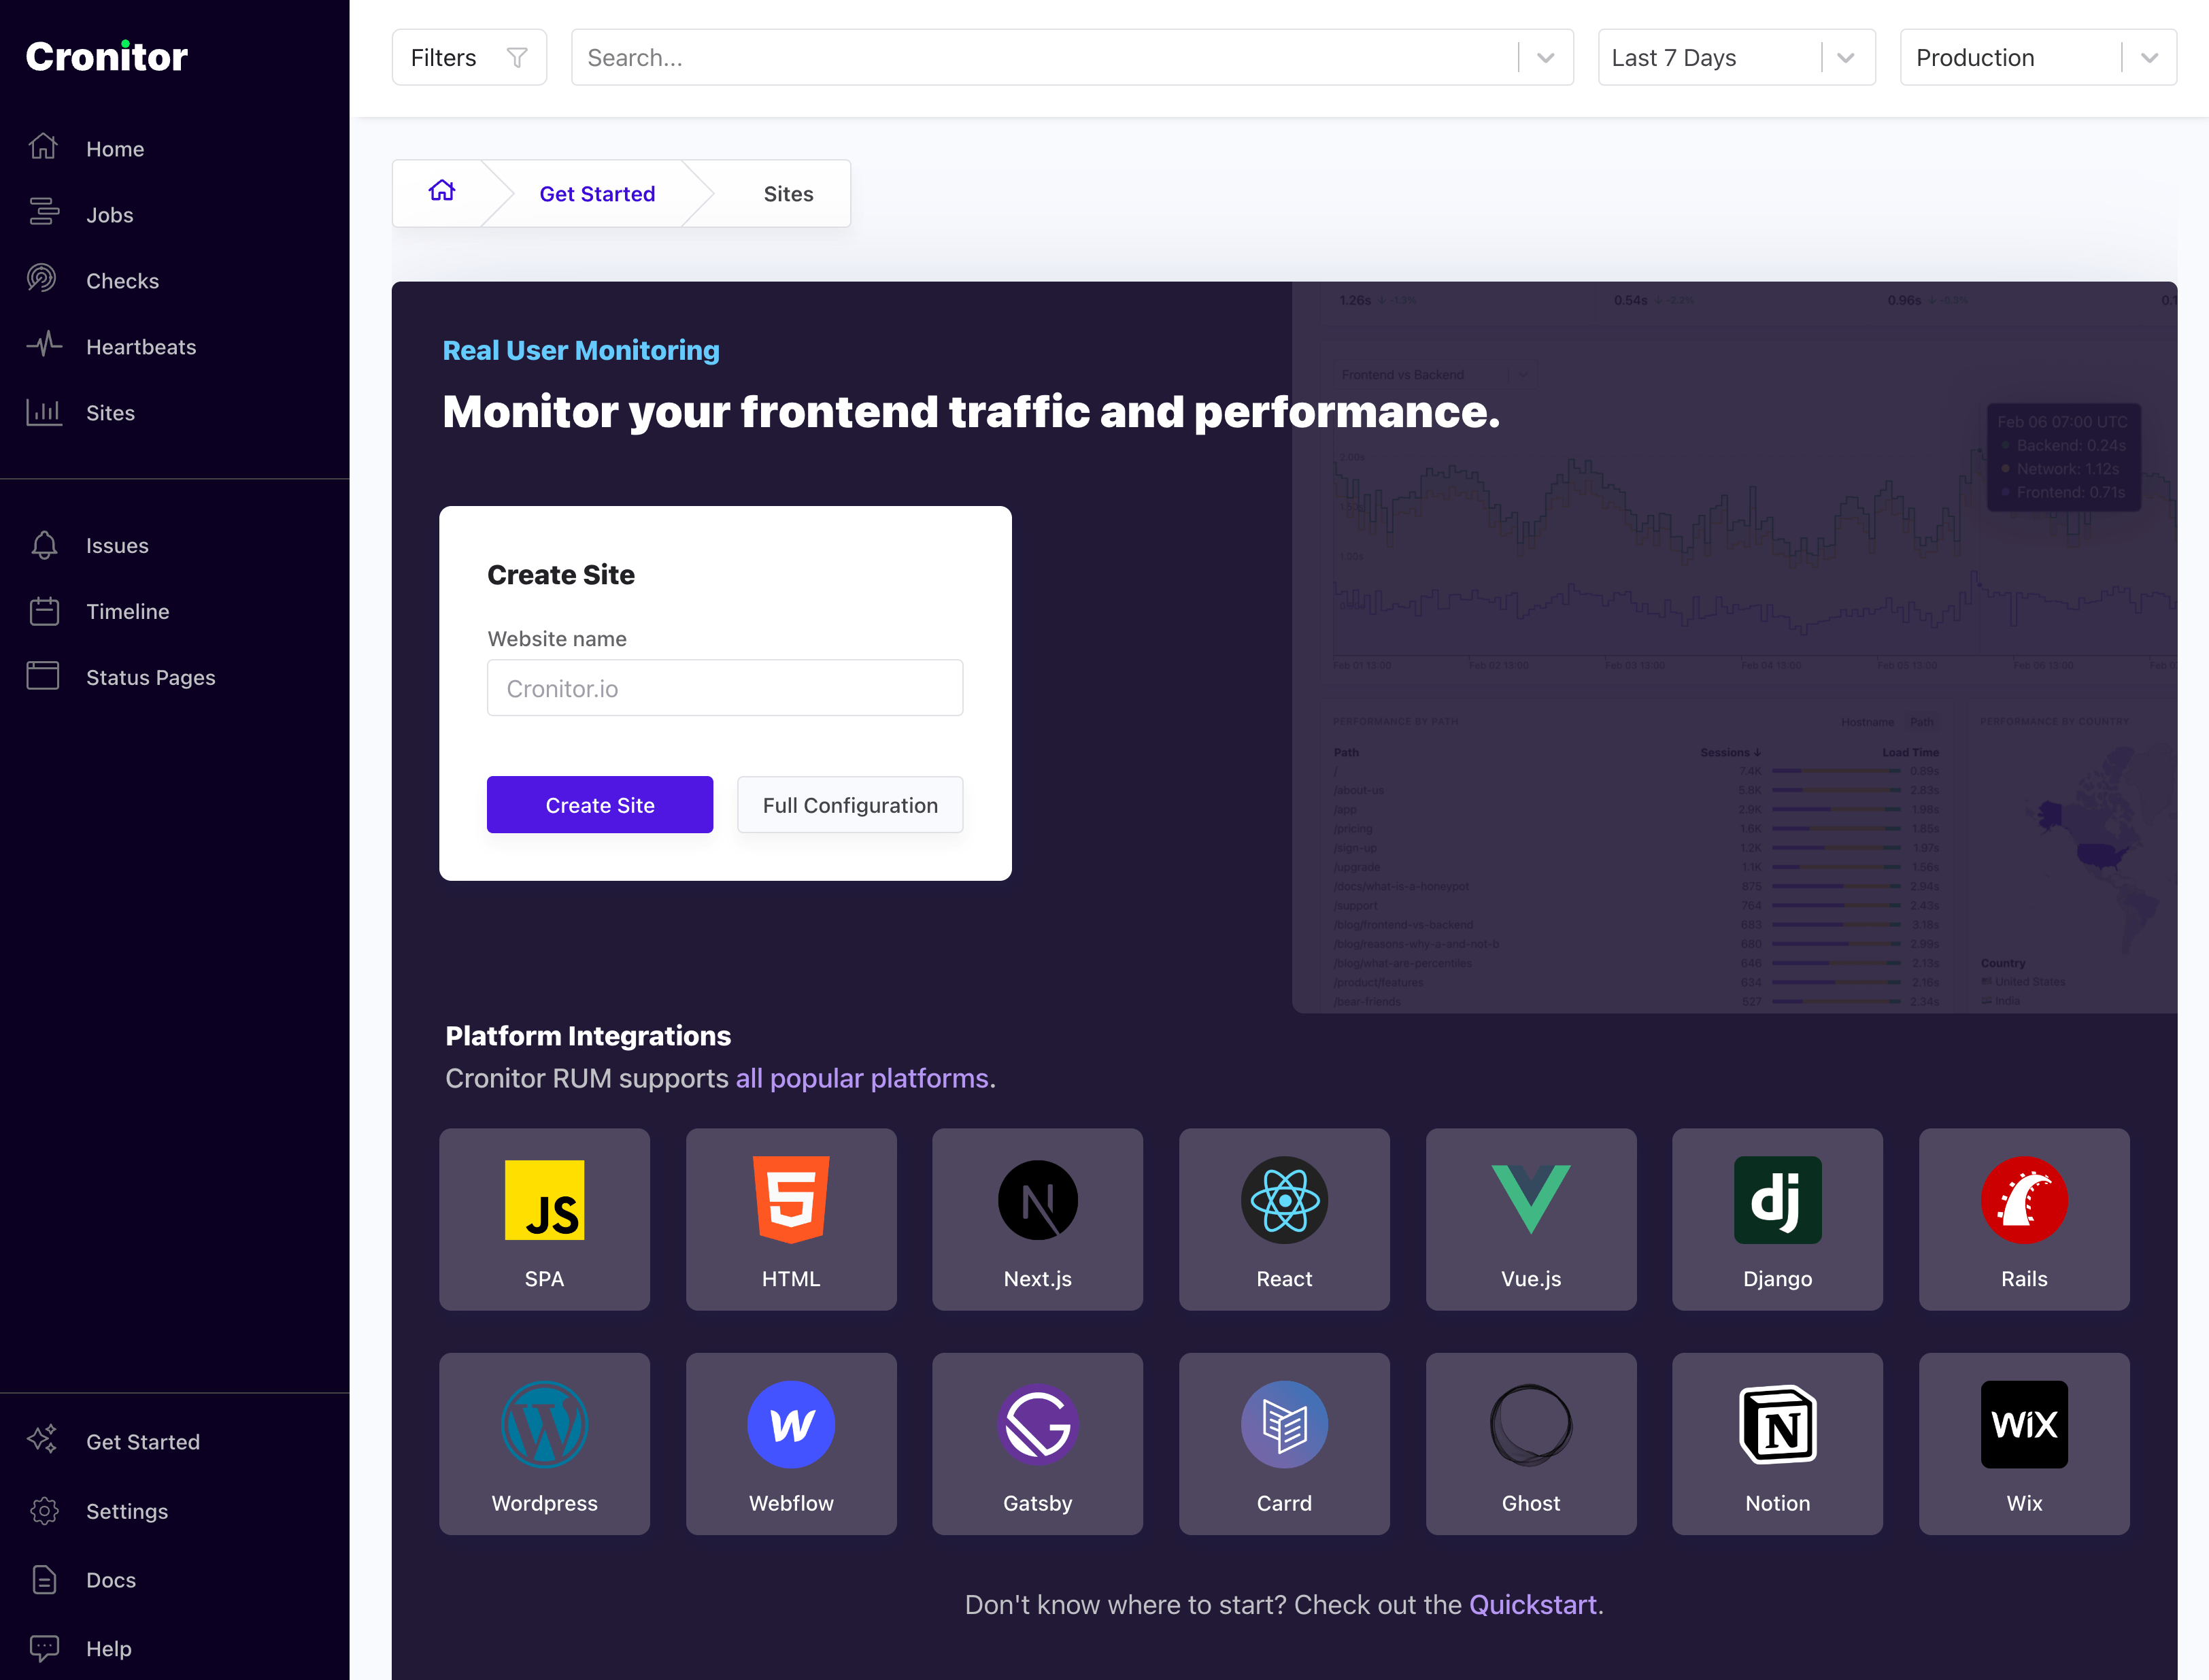
You can pick any name you'd like. It's just to help you recognize it later in case you have multiple sites.
This name can be changed anytime, and is not tied to your domain. In other words if your domain name is www.example.com you can name your site something else like My Website.
Once you've created your site, you'll get a custom tracking snippet. The analytics snippet is a small piece of code that runs on your website, and it collects the metrics necessary to show you the insights in the dashboard.
![]()
Step 2: Install the SDK
Once you have added your website to Cronitor, all that is left to do is to install the tracking snippet on your website.
All you have to do is load this snippet as part of your website's HTML. The snippet works with any website or framework - simply add it to your HTML template or layout file.
Step 3: Collect pageviews
After you have added our analytics script to your website, you should be able to see pageviews show up in the dashboard within a minute of the visitors coming into your website.