Platform
Heartbeat Monitoring
Cronitor's heartbeat monitoring provides a simple way to ensure your systems, services, and processes are running as expected. Send periodic "I'm alive" signals to Cronitor and get alerted when something stops working.
Monitor any system or process with simple heartbeat signals.
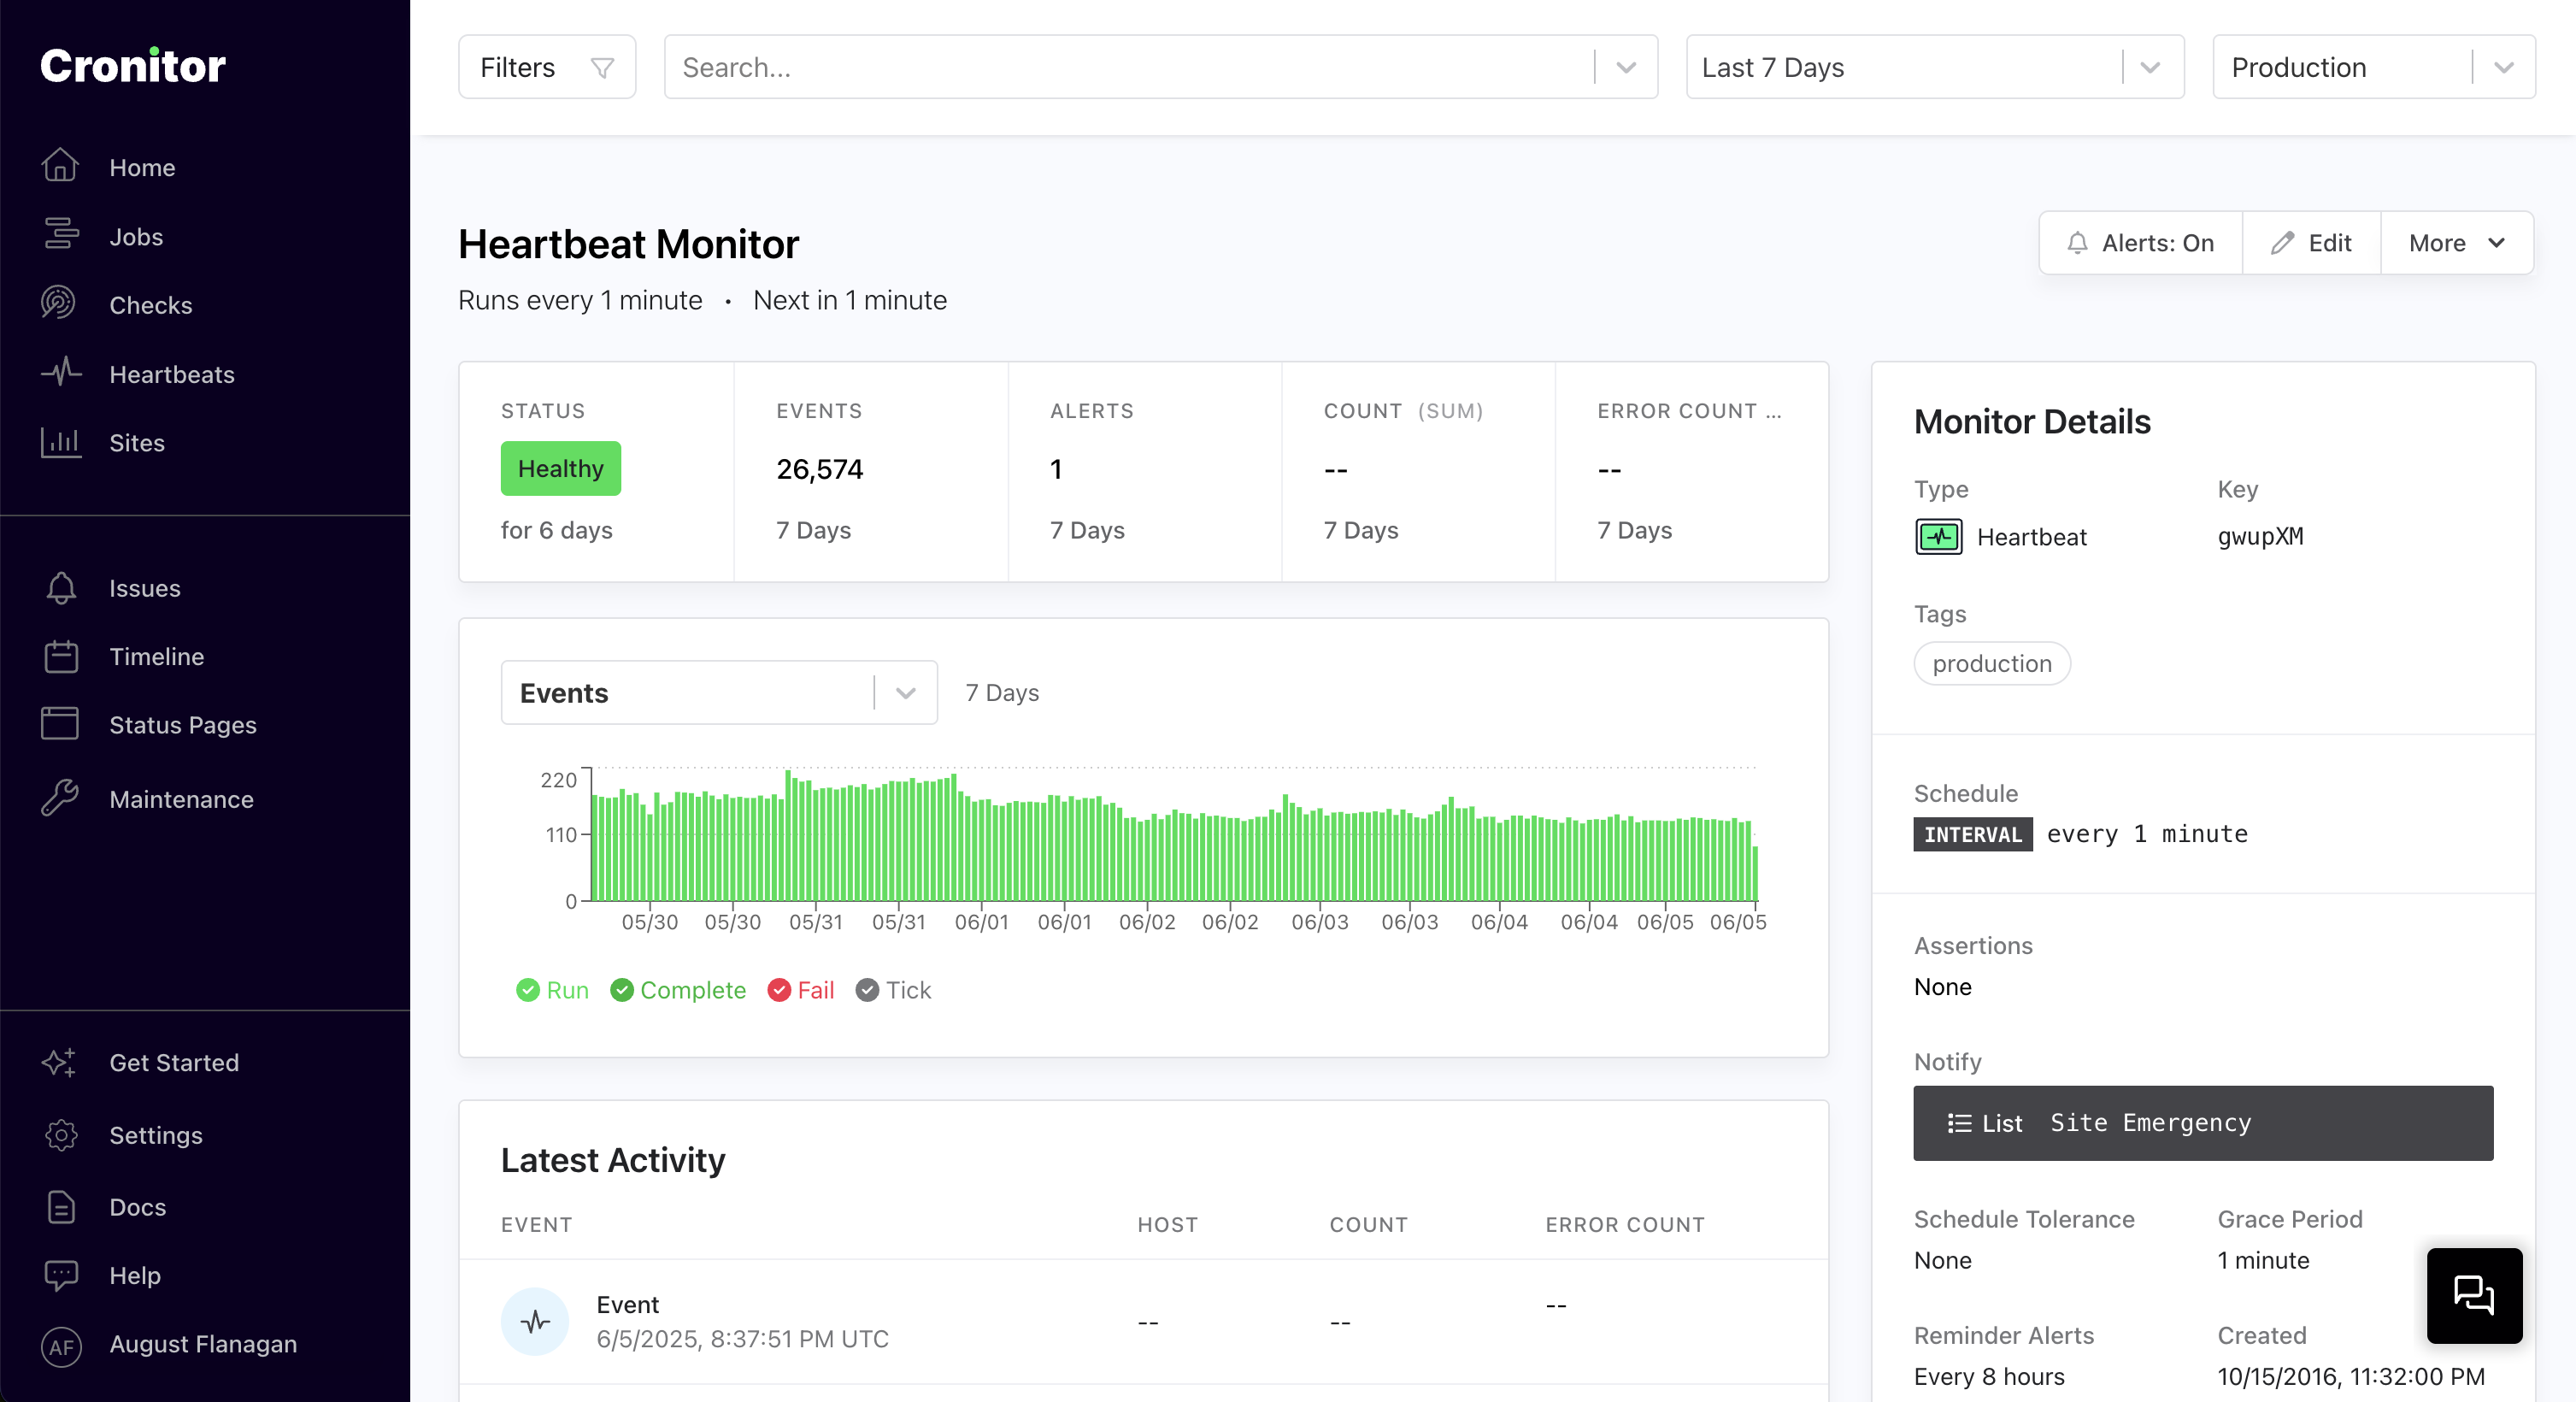
How Heartbeat Monitoring Works
Heartbeat monitoring tracks system health using periodic HTTP requests sent to Cronitor. When heartbeats stop arriving or report failures an alert is sent to the monitor's alert recipients.
| Component | Description |
|---|---|
| Heartbeat Event | Simple HTTP request sent from your system to Cronitor |
| Expected Interval | How often Cronitor expects to receive the heartbeat |
| Alert Trigger | Notification sent when heartbeats are missed or are sent with a fail state |
# Send a simple heartbeat
curl "https://cronitor.link/p/API_KEY/example-heartbeat"

# Send heartbeat with failure
curl "https://cronitor.link/p/API_KEY/monitor-key?state=fail"
Create Heartbeat Monitor
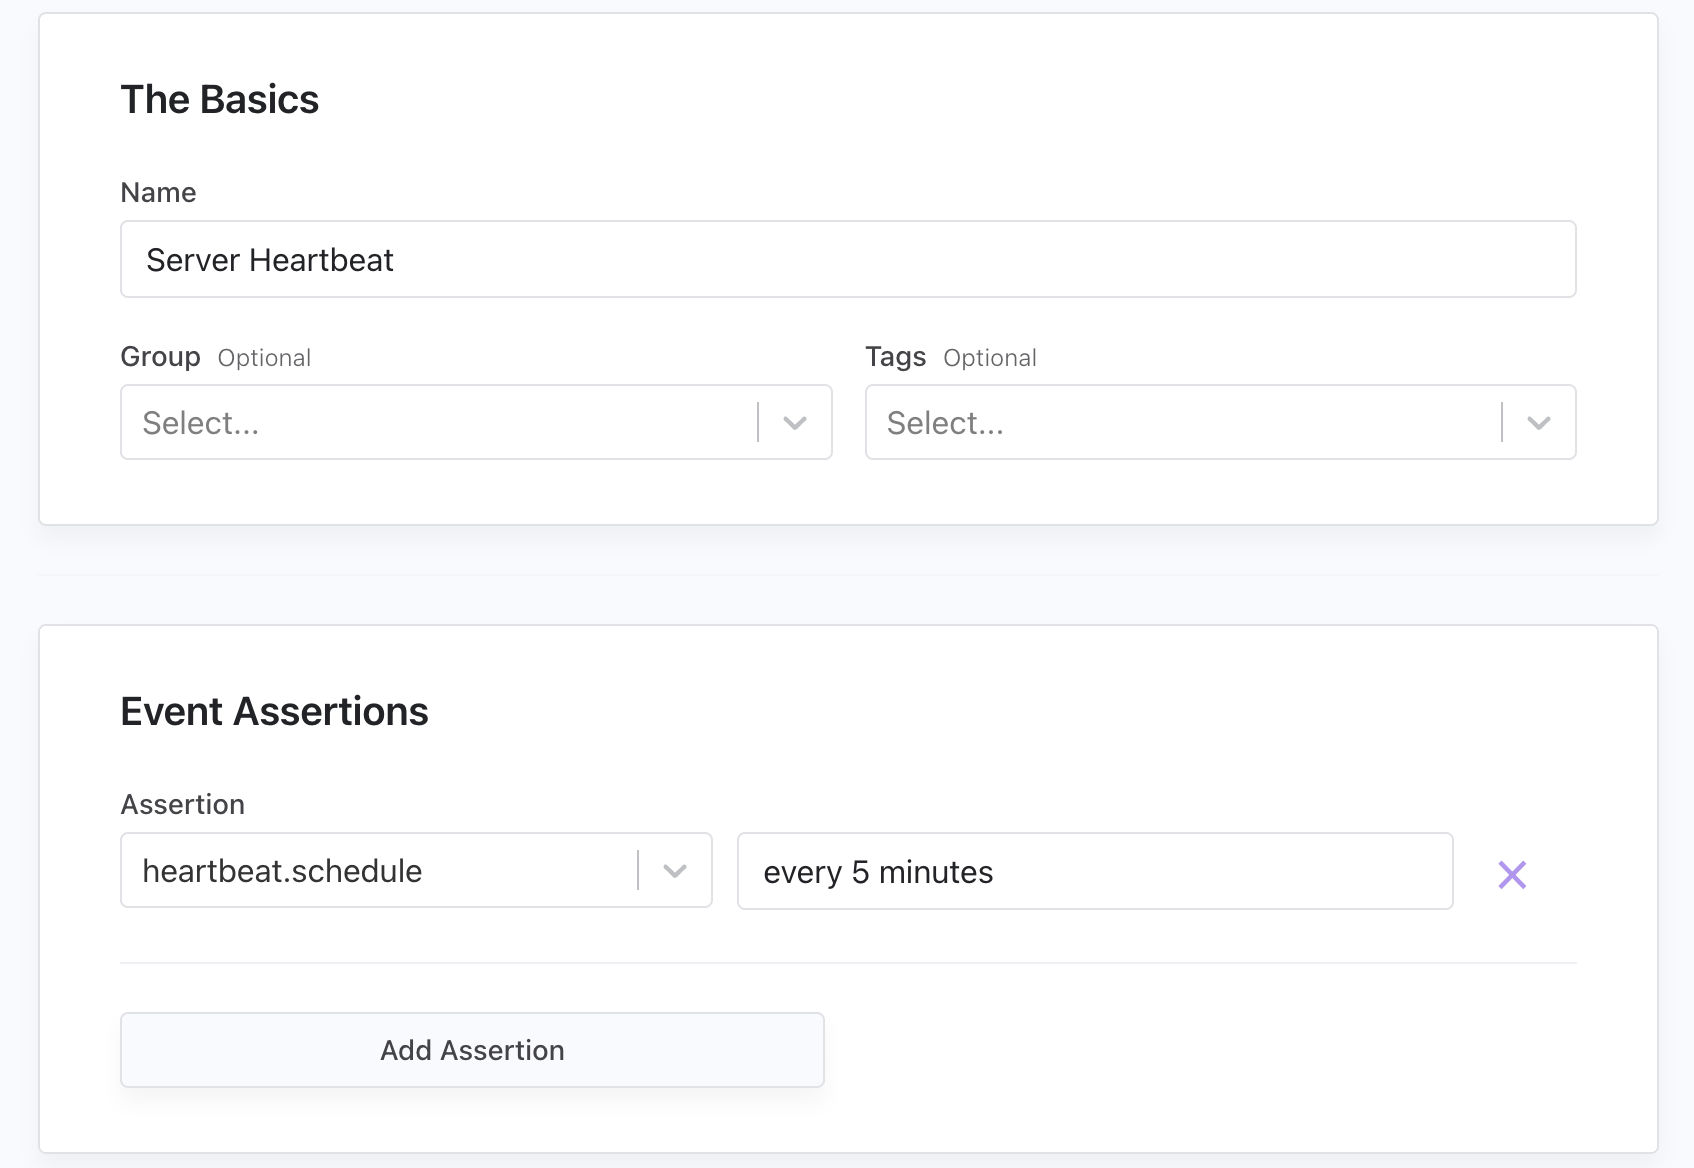
Creating a heartbeat monitor is straightforward. You can create monitors manually via the dashboard or API, or use auto-provisioning to create them automatically when you send your first heartbeat.
Auto-Provisioning
The easiest way to get started is to simply send a heartbeat to Cronitor using your Telemetry API key and a unique monitor name. If no monitor exists with that name, Cronitor will automatically create one for you:
# Auto-provision a heartbeat monitor by sending your first heartbeat
curl "https://cronitor.link/p/API_KEY/service-health"
Manual Creation
For more control over initial configuration, create monitors explicitly using the Cronitor dashboard or Monitor API:
Create Heartbeat Monitor
Monitor API
# Create a heartbeat monitor
curl -X PUT "https://cronitor.io/api/monitors" \
  -u API_KEY: \
  -H "Content-Type: application/json" \
  -d '{
    "key": "service-health",
    "type": "heartbeat",
    "schedule": "every 5 minutes",
    "grace_seconds": 300
  }'
Sending Heartbeats
Send heartbeats using simple HTTP requests to the Telemetry API or through our language SDKs for automatic error handling and retries.
SDK Examples
# Python SDK
import cronitor
cronitor.api_key = 'API_KEY'
monitor = cronitor.Monitor('service-health')
monitor.ping()

# Node.js SDK
const cronitor = require('cronitor')('API_KEY');
const monitor = new cronitor.Monitor('service-health');
monitor.ping();

# Ruby SDK
require 'cronitor'
Cronitor.api_key = 'API_KEY'
monitor = Cronitor::Monitor.new('service-health')
monitor.ping()
Telemetry API
curl "https://cronitor.link/p/API_KEY/service-health"
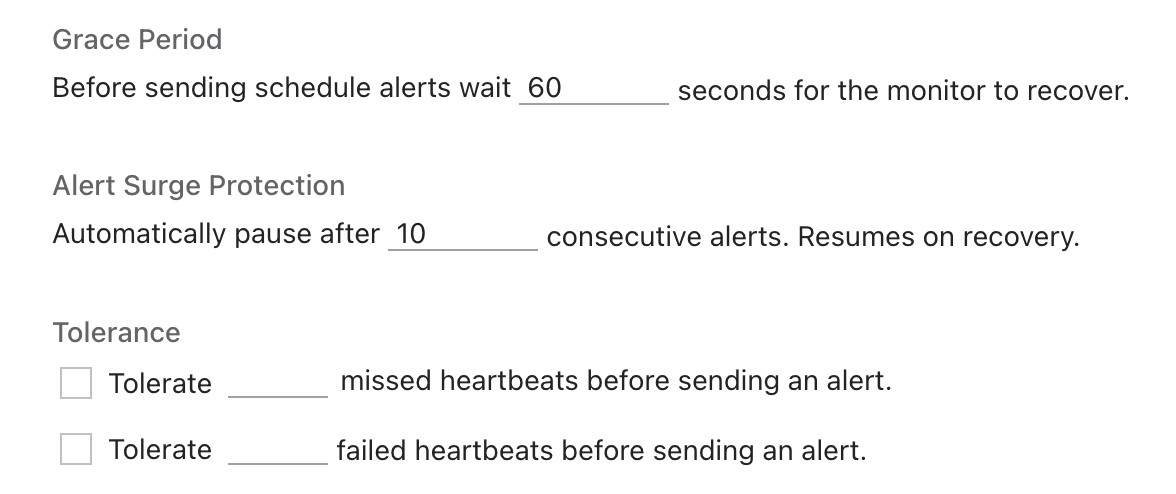
Tolerances & Grace Periods
Make your heartbeat monitoring more flexible and reduce false alerts by configuring how forgiving Cronitor should be. These settings work together to prevent alert fatigue from systems that occasionally experience network issues, temporary outages, or resource constraints.
| Tolerance Type | Description |
|---|---|
| Failure Tolerance | Allow consecutive missed heartbeats before alerting |
| Schedule Tolerance | Allow missed scheduled heartbeats before alerting |
| Grace Period | Allow heartbeats to arrive late without triggering alerts |
| Alert Surge Protection | Automatically pause alerts after consecutive notifications |
Heartbeat tolerance settings
Monitor API
# Configure heartbeat with tolerances
curl -X PUT "https://cronitor.io/api/monitors" \
  -u API_KEY: \
  -H "Content-Type: application/json" \
  -d '{
    "key": "critical-service",
    "type": "heartbeat",
    "schedule": "every 2 minutes",
    "grace_seconds": 120,
    "failure_tolerance": 2,
    "consecutive_alert_threshold": 5
  }'
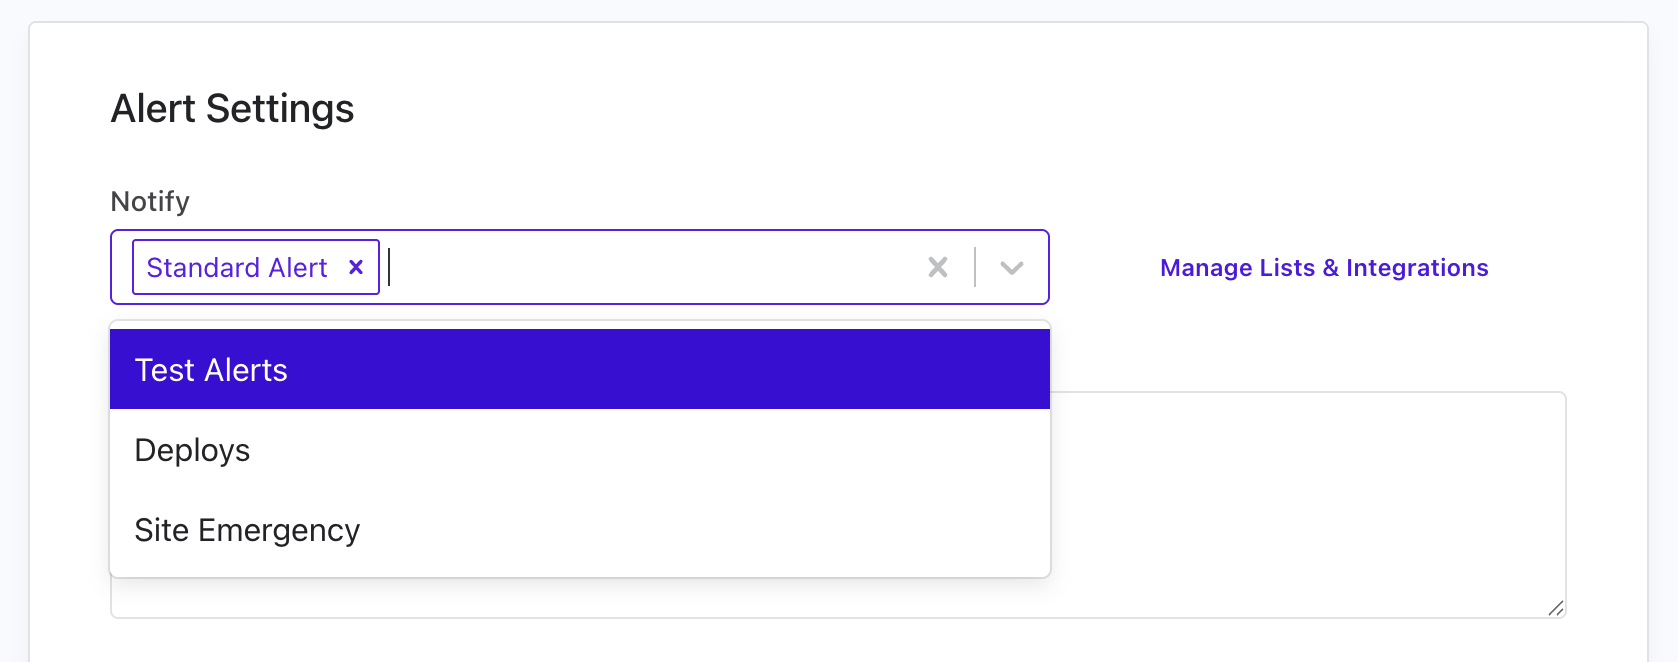
Alert Configuration
When systems stop reporting or send failure signals, you need immediate notification. Cronitor can send alerts to your team through email, Slack, Microsoft Teams, SMS, PagerDuty, webhooks, and more. Setting this up takes just a few steps:
- Create integrations for your preferred services (Slack, Teams, PagerDuty, etc.) in Settings > Integrations
- Create a Notification List with one or more integrations in Settings > Alerts
- Attach your Notification List when creating or updating your heartbeat monitor
Issues & Alert Tracking
When your systems stop sending heartbeats or report failures, Cronitor automatically opens an Issue for team coordination and sends alerts to all the configured recipients. Issues give you a persistent record of a failure/outage and can be published to status pages or kept private for internal outage communication. Issues show all sent alerts and timing for complete incident visibility.
Alert & Notification Settings
Monitor API
# Configure alerts using notification lists (recommended)
curl -X PUT "https://cronitor.io/api/monitors" \
  -u API_KEY: \
  -H "Content-Type: application/json" \
  -d '{
    "key": "critical-service",
    "type": "heartbeat",
    "schedule": "every 5 minutes",
    "notify": ["on-call-team", "dev-alerts"]
  }'
You can also configure alerts directly using formats like email:team@company.com, slack:#alerts, or pagerduty:service-key.
Available Integrations
- Chat Platforms: Slack, Microsoft Teams, Discord
- Incident Management: PagerDuty, OpsGenie, Splunk On-Call
- Direct Notifications: Email addresses, SMS phone numbers
- Custom Integration: Webhooks for any HTTP endpoint
For comprehensive configuration including escalation policies, maintenance windows, and testing your alert setup, see our Alert Documentation.
Environment Support
Separate heartbeat monitoring data between various environments while sharing monitor configurations:
| Environment Type | Description |
|---|---|
| Development/Staging | Test heartbeat monitoring before production deployment |
| Multi-Instance Deployments | Monitor identical services across different environments |
# Send heartbeat to staging environment
curl "https://cronitor.link/p/API_KEY/monitor-key?env=staging" \
  -d "message=Staging service health check"

# Send heartbeat to production environment
curl "https://cronitor.link/p/API_KEY/monitor-key?env=production" \
  -d "message=Production service health check"
Environments are created automatically when you first send a heartbeat with an env parameter. All environments share the same schedule and notification settings, however alerts can be disabled for specific environments. All accounts start with a default production environment.
For detailed environment configuration and management, see our Environment Documentation.