Platform
Website & API Monitoring
Cronitor's uptime monitoring provides real-time visibility into the availability and performance of your websites, APIs, and network services. Monitor from multiple global locations, get instant alerts when issues arise, and track performance trends over time.
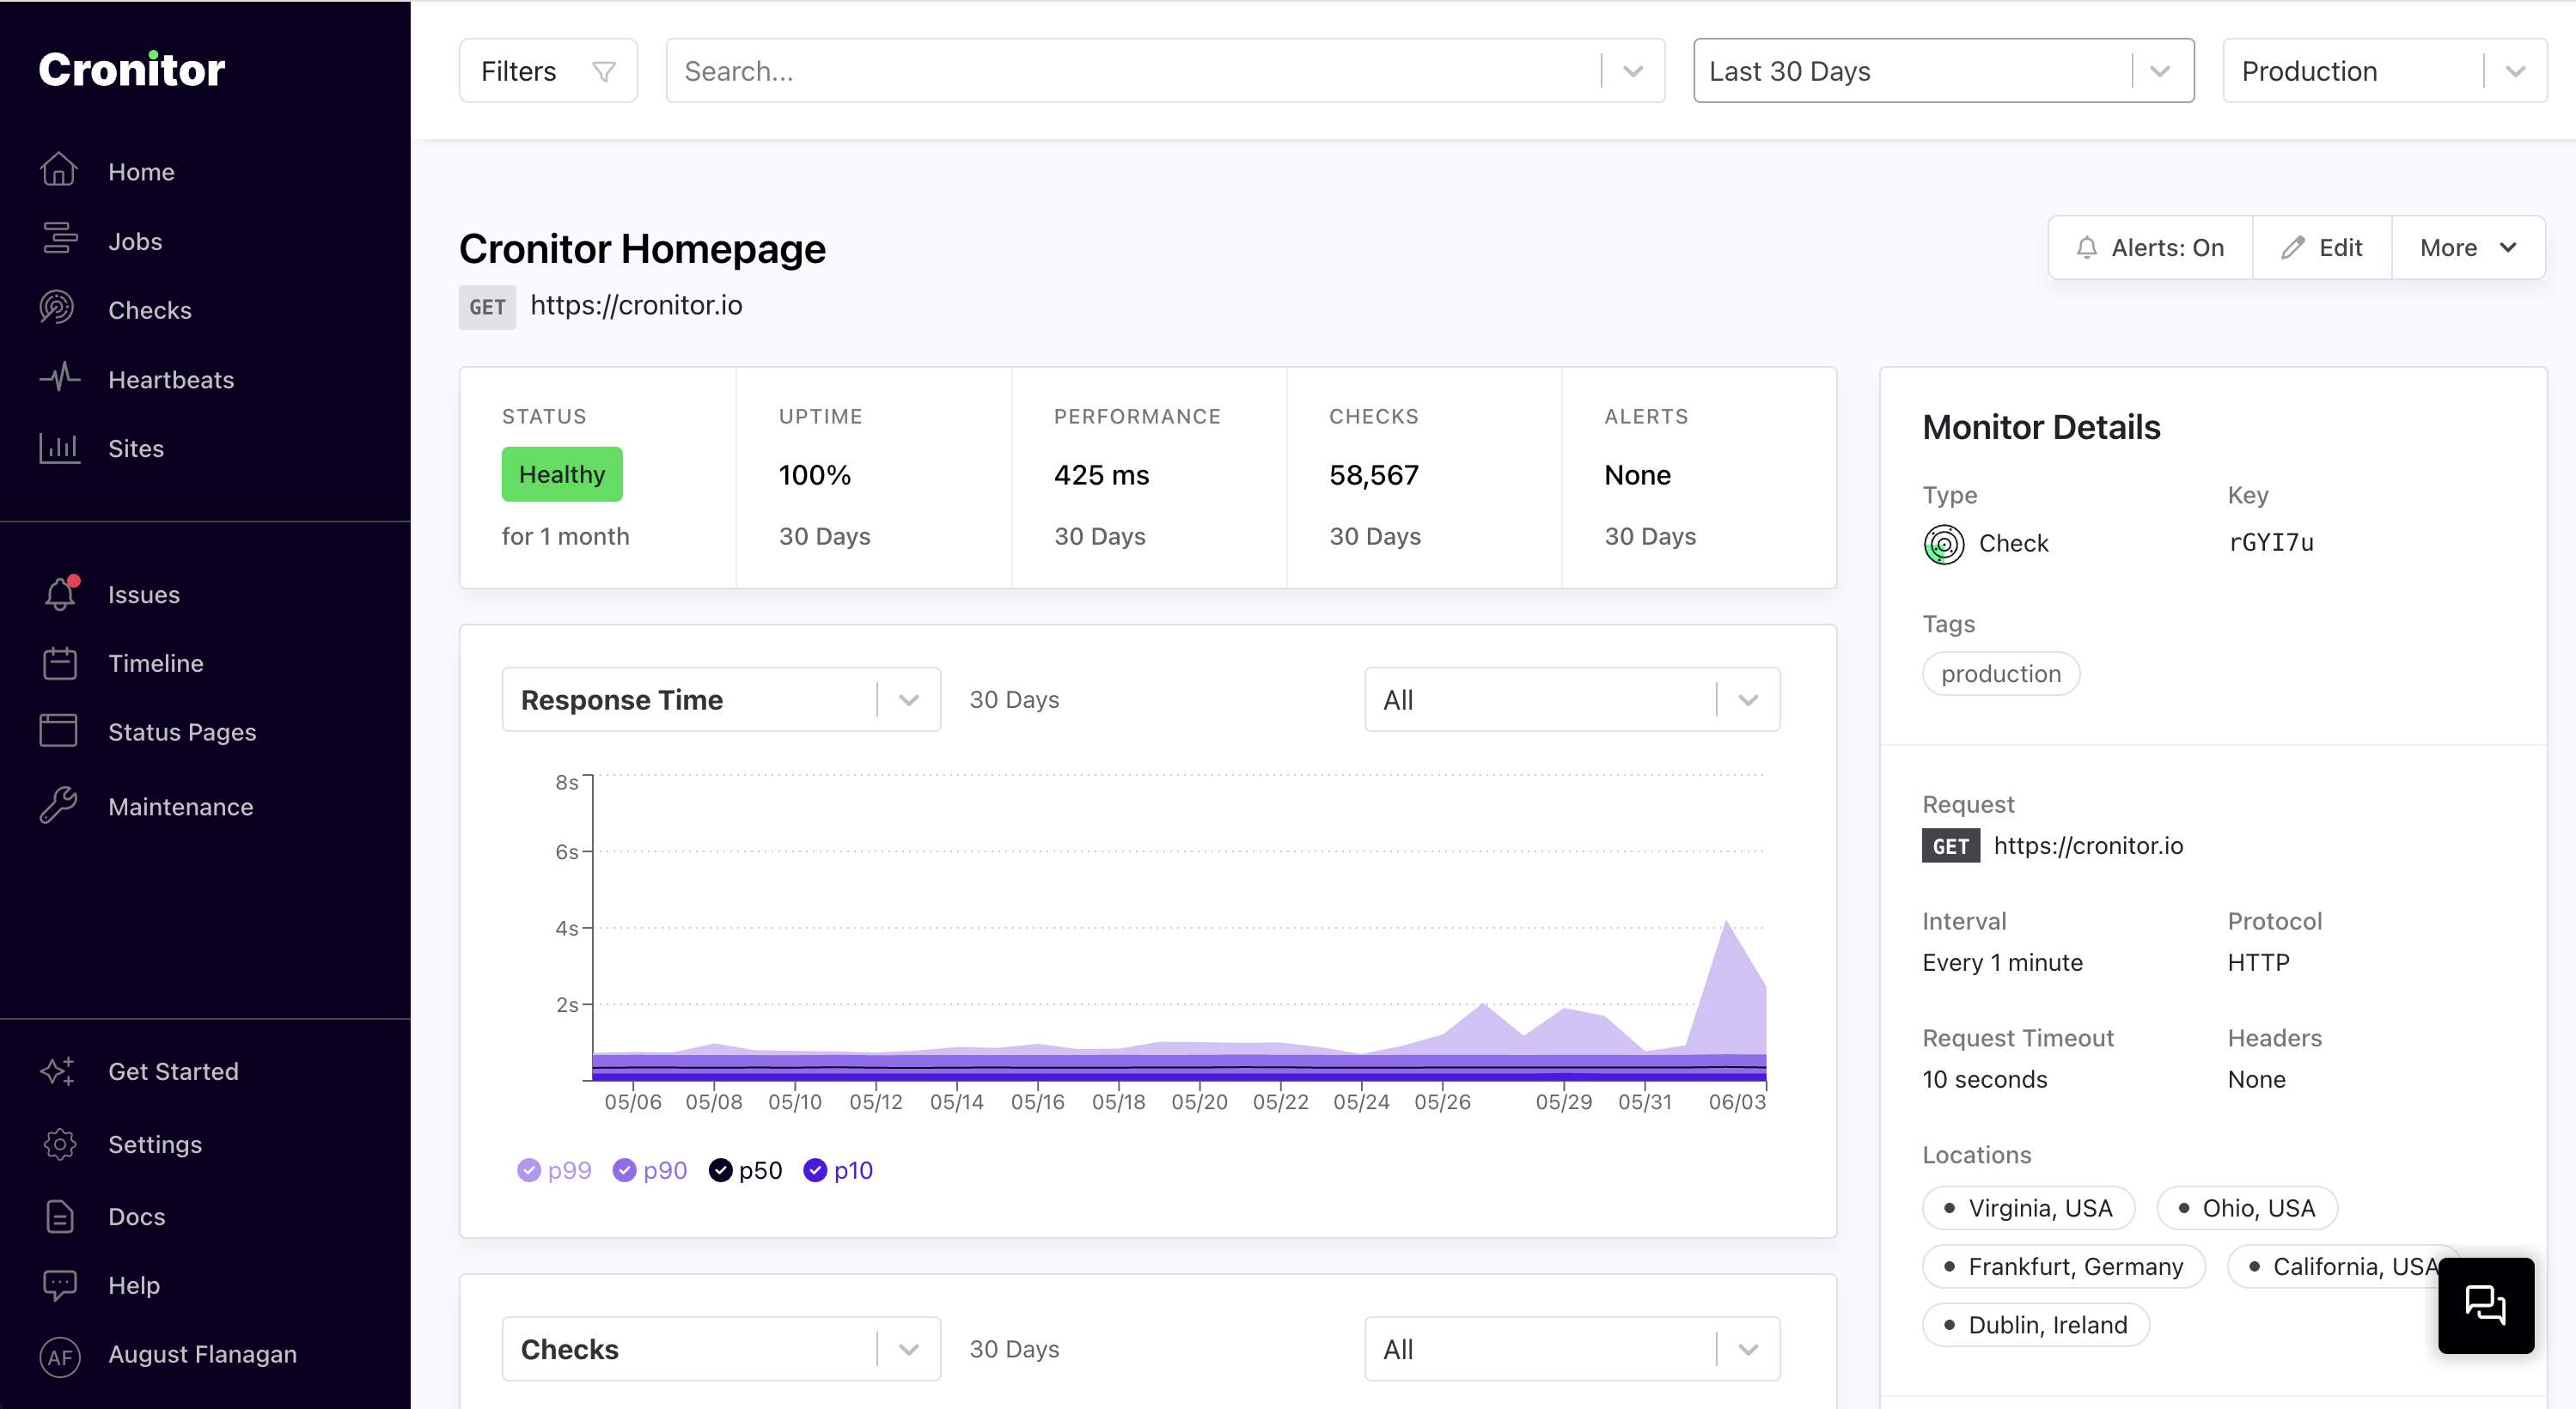
Monitor websites, APIs, and services from around the world.
Creating Your First Monitor
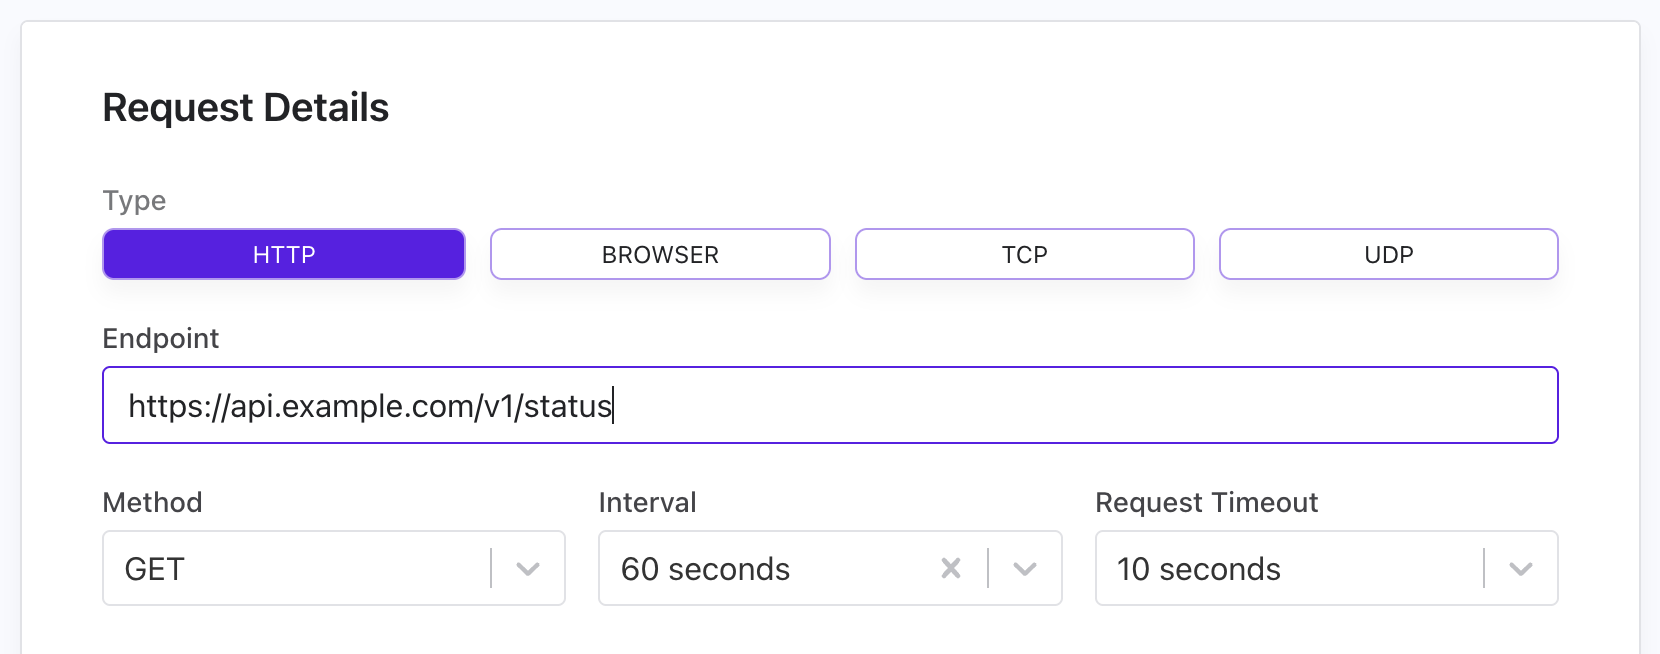
Getting started with uptime monitoring is simple. Choose from three check types based on what you're monitoring:
| Check Type | Best For | Key Features |
|---|---|---|
| HTTP/HTTPS | APIs, web services, REST endpoints | All HTTP methods, custom headers, authentication |
| Browser-Based | Single-page apps, JavaScript-heavy sites | Renders JavaScript, measures browser performance |
| TCP | Databases, mail servers, custom protocols | Direct port connectivity testing |
Create Monitor Interface
Monitor API
# Create HTTP monitor with custom headers
curl -X PUT "https://cronitor.io/api/monitors" \
  -u API_KEY: \
  -H "Content-Type: application/json" \
  -d '{
    "key": "api-endpoint",
    "type": "check",
    "request": {
      "url": "https://api.example.com/v1/status",
      "method": "GET",
    },
    "schedule": "every 1 minute"
  }'
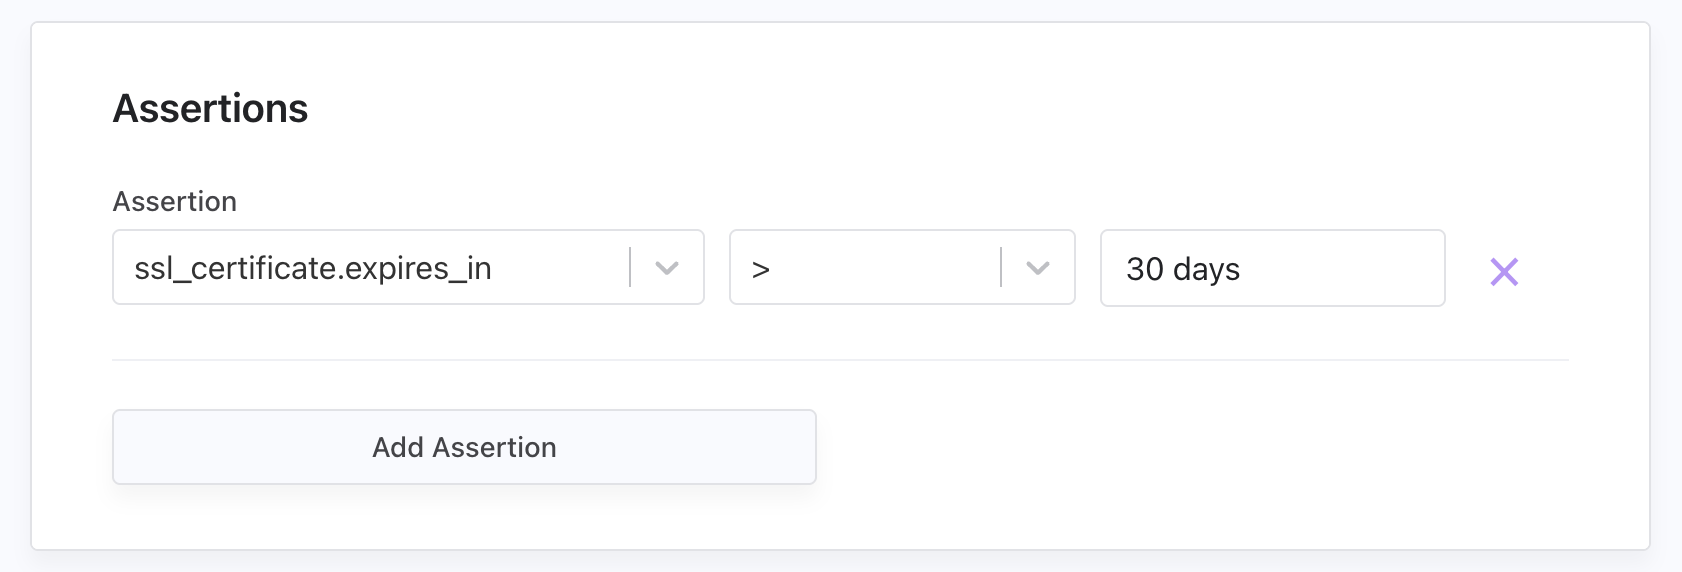
Assertions & Validation
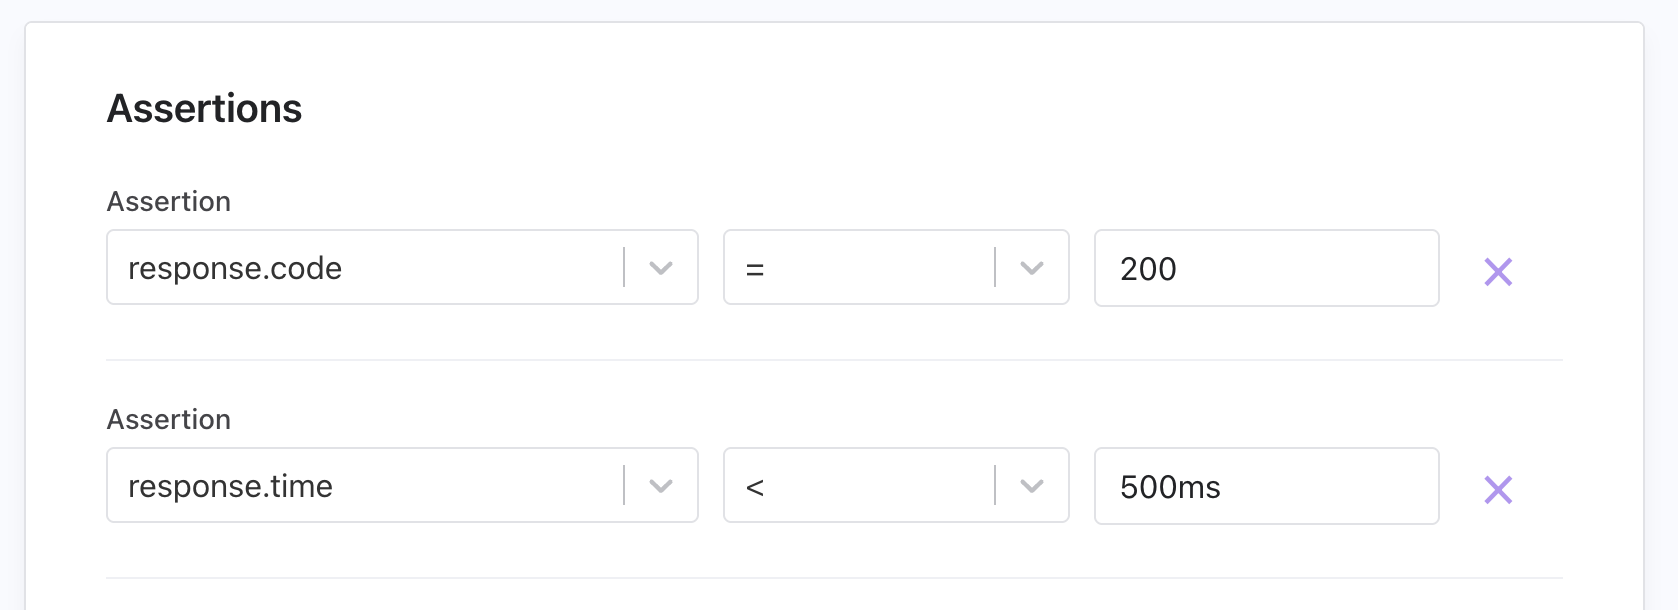
Configure powerful validation rules to ensure your services behave as expected:
| Assertion Type | Example | Use Case |
|---|---|---|
| Response Time | response.time < 2s | Performance monitoring |
| Status Code | response.code = 200 | Success validation |
| Response Body | response.body contains "healthy" | Content verification |
| JSON Response | response.json data.status = "active" | API response validation |
| Headers | response.header Content-Type = "application/json" | Header validation |
| SSL Certificate | ssl_certificate.expires_in > 30 days | Certificate monitoring |
Assertion Configuration
Monitor API
# Create monitor with multiple assertions
curl -X PUT "https://cronitor.io/api/monitors" \
  -u API_KEY: \
  -H "Content-Type: application/json" \
  -d '{
    "key": "api-health",
    "type": "check",
    "request": {
      "url": "https://api.example.com/health"
    },
    "assertions": [
      "response.time < 2s",
      "response.code = 200",
      "response.body contains healthy",
      "response.json data.status = active"
    ]
  }'
Authentication & Security
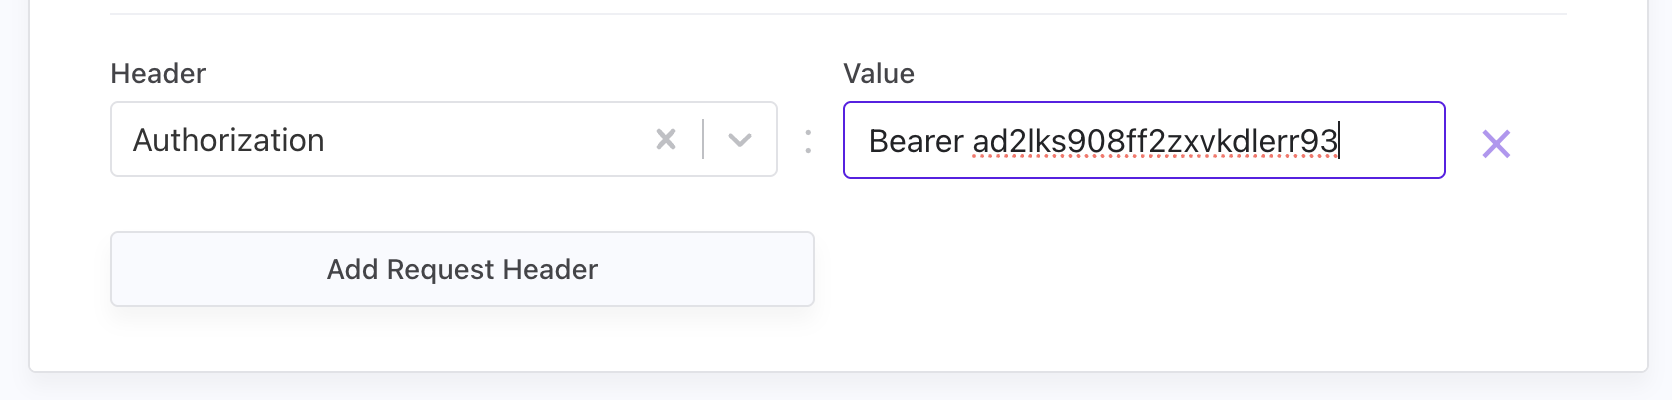
Support for various authentication methods and security features:
| Security Feature | Description |
|---|---|
| Bearer Tokens | API key authentication via Authorization header |
| Basic Auth | Username/password authentication |
| Custom Headers | Flexible authentication schemes and API keys |
Authentication & Security Settings
Monitor API
# Monitor with authentication
curl -X PUT "https://cronitor.io/api/monitors" \
  -u API_KEY: \
  -H "Content-Type: application/json" \
  -d '{
    "key": "secure-api",
    "type": "check",
    "request": {
      "url": "https://secure-api.example.com/health",
      "headers": {
        "Authorization": "Bearer your-api-token",
        "X-API-Key": "your-api-key"
      }
    }
  }'
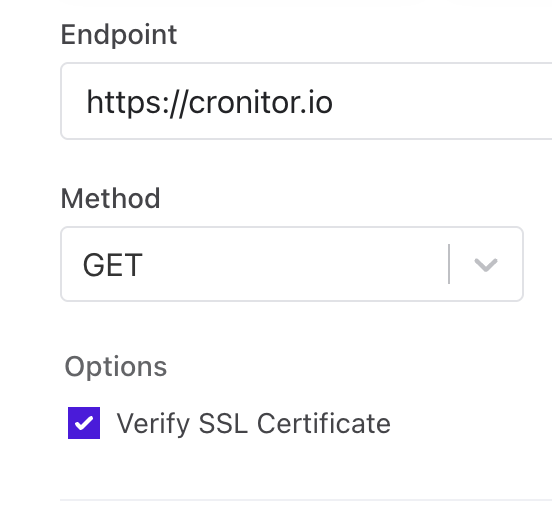
SSL Certificate Monitoring
Cronitor automatically monitors SSL certificate expiration for your HTTPS endpoints. When the "Verify SSL Certificate" option is enabled, we'll send warning alerts before your certificates expire so you can renew them proactively.
| Configuration | Default Behavior | Customization |
|---|---|---|
| SSL Verification | Enabled by default for HTTPS URLs | Can be disabled in monitor settings |
| Warning Threshold | Alert sent 28 days before expiration | Configurable from 1-90 days |
SSL Certificate Configuration
Monitor API
# Configure SSL certificate monitoring
curl -X PUT "https://cronitor.io/api/monitors" \
  -u API_KEY: \
  -H "Content-Type: application/json" \
  -d '{
    "key": "secure-api",
    "type": "check",
    "request": {
      "url": "https://secure-api.example.com/health",
      "verify_ssl": true
    },
    "assertions": [
      "ssl_certificate.expires_in > 30 days"
    ]
  }'
Configuring SSL Monitoring
SSL Assertions Configuration
Custom SSL Assertions
To adjust SSL certificate monitoring settings:
- Enable/Disable SSL Verification: Toggle the "Verify SSL Certificate" checkbox in your monitor configuration
- Custom Warning Period: Add a custom assertion like
ssl_certificate.expires_in > 45 daysto receive alerts 45 days before expiration - Disable SSL Alerts: Uncheck SSL verification or remove SSL assertions to stop certificate monitoring
Note: SSL certificate notifications are sent as a "Warning" rather than an "Alert", helping you distinguish between actual downtime and proactive maintenance reminders.
Check Regions & IP Addresses
Configure monitoring frequency and global coverage based on your requirements. Cronitor operates monitoring nodes in the following locations:
| Location | Region |
|---|---|
| US East 1 (N. Virginia) | us-east-1 |
| US East 2 (Ohio) | us-east-2 |
| US West 1 (N. California) | us-west-1 |
| EU West 1 (Ireland) | eu-west-1 |
| EU Central 1 (Frankfurt) | eu-central-1 |
| EU North 1 (Stockholm) | eu-north-1 |
| AP South 1 (Mumbai) | ap-south-1 |
| AP Northeast 1 (Tokyo) | ap-northeast-1 |
| AP Southeast 1 (Singapore) | ap-southeast-1 |
| AP Southeast 2 (Sydney) | ap-southeast-2 |
| SA East 1 (São Paulo) | sa-east-1 |
# Configure specific regions and frequency
curl -X PUT "https://cronitor.io/api/monitors" \
  -u API_KEY: \
  -H "Content-Type: application/json" \
  -d '{
    "key": "global-api",
    "type": "check",
    "request": {
      "url": "https://api.example.com/health"
    },
    "schedule": "every 30 seconds",
    "regions": ["us-east-1", "eu-west-1", "ap-southeast-1"]
  }'
Fixed IP Addresses
For enhanced security, Cronitor offers both dynamic and fixed IP address pools:
- Dynamic IPs: Standard monitoring from our global network
- Fixed IP Pool: Static IP addresses for firewall whitelisting and enhanced security
Static IP addresses are available in US West, US East, EU West, and EU Central regions. Enable them in your account settings, and access the list of Static IPs.
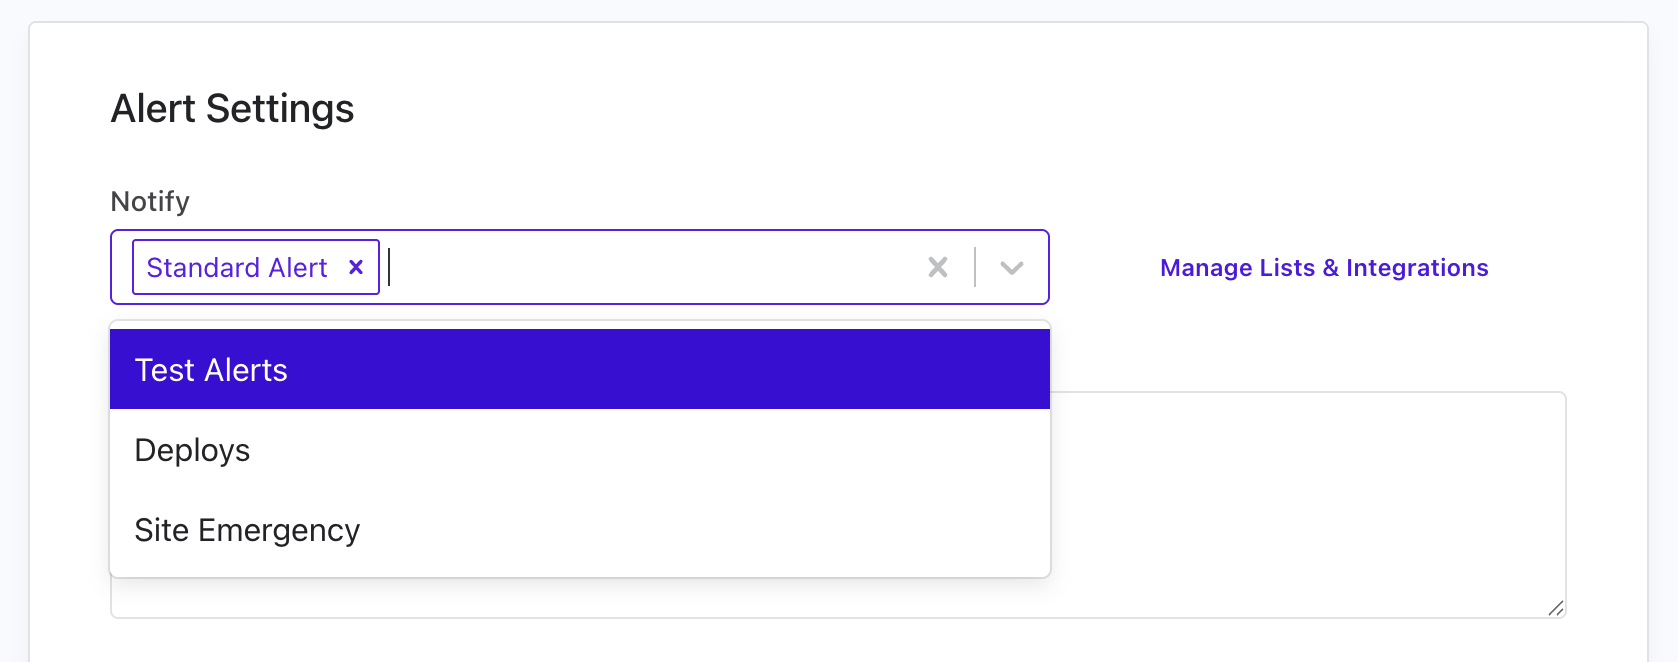
Alert Configuration
When your websites and APIs go down, you need to know immediately. Cronitor can send alerts to your team through email, Slack, Microsoft Teams, SMS, PagerDuty, webhooks, and more. Setting this up takes just a few steps:
- Create integrations for your preferred services (Slack, Teams, PagerDuty, etc.) in Settings > Integrations
- Create a Notification List with one or more integrations in Settings > Alerts
- Attach your Notification List when creating or updating your uptime monitor
Issues & Alert Tracking
When your websites or APIs have problems, Cronitor automatically opens an Issue for team coordination and sends alerts to all the configured recipients. Issues give you a persistent record of a failure/outage and can be published to status pages or kept private for internal outage communication. Issues show all sent alerts and timing for complete incident visibility.
Alert & Notification Settings
Monitor API
# Configure alerts using notification lists (recommended)
curl -X PUT "https://cronitor.io/api/monitors" \
  -u API_KEY: \
  -H "Content-Type: application/json" \
  -d '{
    "key": "api-endpoint",
    "type": "check",
    "request": {
      "url": "https://api.example.com/v1/status"
    },
    "notify": ["on-call-team", "dev-alerts"]
  }'
You can also configure alerts directly using formats like email:team@company.com, slack:#alerts, or pagerduty:service-key.
Available Integrations
- Direct Notifications: Email & SMS notifications
- Chat Platforms: Slack, Microsoft Teams, Discord
- Incident Management: PagerDuty, OpsGenie, Splunk On-Call
- Custom Integration: Webhooks for any HTTP endpoint
For comprehensive configuration including escalation policies, maintenance windows, and testing your alert setup, see our Alert Documentation.
Environment Support
While it's common to want separate monitoring for your development, staging, and production infrastructure, uptime monitors in Cronitor operate differently than you might expect. All uptime checks run within your account's default environment (typically "production"), regardless of what you're monitoring.
To monitor different environments of your infrastructure, simply create separate monitors for each endpoint:
https://staging.mywebsite.com→ One uptime monitorhttps://production.mywebsite.com→ Another uptime monitor
This approach gives you clear visibility into each environment's health while keeping your monitoring setup simple and straightforward.